UNITED STATES
SECURITIES AND EXCHANGE COMMISSION
Washington, D.C. 20549
FORM 10-K
| ANNUAL REPORT PURSUANT TO SECTION 13 OR 15(d) OF THE SECURITIES EXCHANGE ACT OF 1934 |
For the fiscal year ended December 31 , 2025
OR
| TRANSITION REPORT PURSUANT TO SECTION 13 OR 15(d) OF THE SECURITIES EXCHANGE ACT OF 1934 |
For the transition period from _________________ to _________________
Commission file number 0-15341
(Exact name of registrant as specified in its charter)
| | | |
| (State or other jurisdiction of incorporation or organization) | (I.R.S. Employer Identification No.) |
| | | |
| (Address of principal executive offices) | (Zip code) |
Registrant’s telephone number, including area code: (800 ) 877-0600
Securities registered pursuant to Section 12(b) of the Act:
| Title of Each Class | Trading Symbols | Name of Each Exchange on Which Registered | ||
| | | The | ||
| | | The |
Securities registered pursuant to Section 12(g) of the Act: None.
Indicate by check mark whether the registrant is a well-known seasoned issuer as defined in Rule 405 of the Securities Act: Yes ☐. No ☑.
Indicate by check mark if the registrant is not required to file reports pursuant to Section 13 or 15(d) of the Act. Yes ☐. No ☑.
Indicate by check mark whether the registrant (1) has filed all reports required to be filed by Section 13 or 15(d) of the Securities Exchange Act of 1934 during the preceding 12 months (or for such shorter period that the registrant was required to file such reports) and (2) has been subject to such filing requirements for the past 90 days. Yes ☑. No ☐.
Indicate by check mark whether the registrant has submitted electronically every Interactive Data File required to be submitted pursuant to Rule 405 of Regulation S-T (§232.405 of this chapter) during the preceding 12 months (or for such shorter period that the registrant was required to submit such files). Yes ☑. No ☐.
Indicate by check mark whether the registrant is a large accelerated filer, an accelerated filer, a non-accelerated filer, a smaller reporting company or an emerging growth company. See definitions of “large accelerated filer,” “accelerated
filer,” “smaller reporting company” and “emerging growth company” in Rule 12b-2 of the Act. (Check one):
| Large accelerated filer ☐ | | Non-accelerated filer ☐ | Smaller reporting company |
| Emerging growth company |
If an emerging growth company, indicate by check mark if the registrant has elected not to use the extended transition period for complying with any new or revised financial accounting standards provided pursuant to Section 13(a) of the Exchange
Act. ☐.
Indicate by check mark whether the registrant has filed a report on and attestation to its management’s assessment of the effectiveness of its internal control over financial reporting under Section 404(b) of the Sarbanes-Oxley Act (15 U.S.C. 7262(b)) by the registered public accounting firm that prepared or issued its audit report. Yes ☑ . No ☐.
If securities are registered pursuant to Section 12(b) of the Act, indicate by check mark whether the financial statements of the registrant included in the filing reflect the correction of an error to previously issued financial statements. ☐ .
Indicate by check mark whether any of those error corrections are restatements that required a recovery analysis of incentive-based compensation received by any of the registrant’s executive officers during the relevant recovery period pursuant to
Section 240.10D-1(b). ☐.
Indicate by check mark whether the registrant is a shell company (as defined in Rule 12b-2 of the Act). Yes ☐. No ☑ .
State the aggregate market value of the voting and non-voting common equity held by non-affiliates computed by reference to the price at which the common equity was last sold, or the average bid and asked price of such common equity, as of the last business day of the registrant’s most recently completed second fiscal quarter. $355,484,764 .
Indicate the number of shares outstanding of each of the registrant’s classes of common stock, as of the latest practicable date: 31,426,189 shares of Class A common stock and 5,576,775 shares of Class B common stock outstanding on March 2, 2026.
Documents Incorporated by Reference
The registrant incorporates by reference portions of the registrant’s definitive proxy statement relating to registrant’s annual meeting of stockholders to be held April 16, 2026 into Part III of this report.
|
Page
|
||
|
PART I
|
||
|
Item 1.
|
1
|
|
|
Item 1A.
|
26
|
|
|
Item 1B.
|
41 | |
|
Item 1C.
|
41 | |
|
Item 2.
|
42 | |
|
Item 3.
|
43 | |
|
Item 4.
|
43 | |
|
PART II
|
||
|
Item 5.
|
44 | |
|
Item 6.
|
45 | |
|
Item 7.
|
46 | |
|
Item 7A.
|
62 | |
|
Item 8.
|
64 | |
|
Item 9.
|
110 | |
|
Item 9A.
|
110
|
|
|
Item 9B.
|
110
|
|
|
Item 9C.
|
110 | |
|
PART III
|
||
|
Item 10.
|
112 | |
|
Item 11.
|
112
|
|
|
Item 12.
|
112
|
|
|
Item 13.
|
112
|
|
|
Item 14.
|
112 | |
|
PART IV
|
||
|
Item 15.
|
113 | |
|
Item 16.
|
116 |
Introduction
Donegal Group Inc., or DGI, is an insurance holding company whose insurance subsidiaries and affiliates offer property and casualty insurance in 21 Mid-Atlantic, Midwestern, Southern and Southwestern states. DGI has no
significant business operations and is separate and distinct from its insurance subsidiaries. As used in this Form 10-K Report, the terms “we,” “us” and “our” refer to Donegal Group Inc. and its insurance subsidiaries. Our Class A common stock and
our Class B common stock trade on the NASDAQ Global Select Market under the symbols “DGICA” and “DGICB,” respectively.
Donegal Mutual Insurance Company, or Donegal Mutual, organized us as an insurance holding company on August 26, 1986. At December 31, 2025, Donegal Mutual held approximately 44% of our outstanding Class A common stock
and approximately 85% of our outstanding Class B common stock. Donegal Mutual’s ownership provides Donegal Mutual with approximately 70% of the combined voting power of our outstanding shares of Class A common stock and our outstanding shares of
Class B common stock. Our insurance subsidiaries and Donegal Mutual have interrelated operations due to an intercompany pooling agreement and other intercompany agreements and transactions we describe in Note 3 of the Notes to Consolidated Financial
Statements. While maintaining the separate corporate existence of each company, our insurance subsidiaries conduct business together with Donegal Mutual and its insurance subsidiaries as the Donegal Insurance Group. The Donegal Insurance Group is not
a legal entity, is not an insurance company and does not issue or administer insurance policies. Rather, it is a trade name that refers to the group of insurance companies that are affiliated with Donegal Mutual.
At December 31, 2025, we had three segments: our investment function, our commercial lines of insurance and our personal lines of insurance. We set forth financial information about these segments in Note 18 of the
Notes to Consolidated Financial Statements. The commercial lines products of our insurance subsidiaries consist primarily of commercial automobile, commercial multi-peril and workers’ compensation policies. The personal lines products of our
insurance subsidiaries consist primarily of homeowners and private passenger automobile policies.
Our insurance subsidiaries and Donegal Mutual provide their policyholders with a selection of insurance products and pursue profitability by adhering to a strict underwriting discipline. Our insurance subsidiaries
derive a substantial portion of their insurance business from smaller to mid-sized regional communities. We believe this focus provides our insurance subsidiaries with competitive advantages in terms of local market knowledge, marketing,
underwriting, claims servicing and policyholder service. At the same time, we believe our insurance subsidiaries have cost advantages over many smaller regional insurers that result from economies of scale our insurance subsidiaries realize through
centralized accounting, administrative, data processing, investment and other services.
We believe we have a substantial opportunity, as a well-capitalized regional insurance holding company with a solid business strategy, to grow profitably and compete effectively with larger national property and casualty
insurers. Our downstream holding company structure, with Donegal Mutual holding approximately 70% of the combined voting power of our common stock, has proven its effectiveness and success over the 39 years of our existence. Over that time period, we
have grown significantly in terms of revenue and financial strength, and the Donegal Insurance Group has developed an excellent reputation as a regional group of property and casualty insurers.
Between 1998 and 2017, we and Donegal Mutual completed seven transactions involving acquisitions of property and casualty insurance companies or participation in the business of property and casualty insurance companies
through Donegal Mutual’s entry into quota-share reinsurance agreements with them. We are currently placing less emphasis on pursuing acquisitions because Donegal Mutual and we believe there are opportunities for profitable organic growth in our
desired markets and classes of business within our current geographical footprint.
In September 2025, Donegal Mutual and Southern entered into a renewal rights agreement with a farm-focused Pennsylvania-based mutual insurance company to provide a continuation option for our farm policyholders when
they begin to non-renew all farm policies as they expire beginning in the second quarter of 2026. Donegal Mutual and Southern determined that the costs required to modernize the legacy farm product and systems were higher than the projected return
on investment for this non-core line of business that represents approximately $6 million in premiums. We currently include farm policies within other commercial lines in our line of business reporting.
Available Information
You may obtain our Annual Reports on Form 10-K, including this Form 10-K Report, our quarterly reports on Form 10-Q, our current reports on Form 8-K, our proxy statement and our other filings pursuant to the Securities
Exchange Act of 1934, or the Exchange Act, without charge by viewing our website at www.donegalgroup.com. You may also view our Code of Business Conduct and Ethics and the charters of the executive
committee, the audit committee, the compensation committee and the nominating committee of our board of directors on our website. Upon request to our corporate secretary, we will also provide printed copies of any of these documents to you without
charge. We have provided the address of our website solely for the information of investors. We do not intend the reference to our website address to be an active link or to otherwise incorporate the contents of our website into this Form 10-K
Report. In addition to our website, the Securities and Exchange Commission (the “SEC”) maintains an Internet site at www.sec.gov that contains our reports, proxy and information statements and other
information that we electronically file with, or furnish to, the SEC.
History and Organizational Structure
In the mid-1980’s, Donegal Mutual, as a mutual insurance company, recognized the desirability of developing additional sources of capital and surplus so it could remain competitive, expand its business and ensure its
long-term viability. Accordingly, Donegal Mutual determined that the implementation of a downstream holding company structure was a viable business strategy to accomplish that objective. Thus, in 1986, Donegal Mutual formed us as a downstream holding
company, and we incorporated in the state of Delaware as Donegal Group Inc. After Donegal Mutual formed us, we in turn formed Atlantic States Insurance Company, or Atlantic States, as our wholly owned property and casualty insurance company
subsidiary.
In connection with the formation of Atlantic States and the establishment of our downstream insurance holding company system, Donegal Mutual and Atlantic States entered into a proportional reinsurance agreement, or
pooling agreement. Under the pooling agreement, Donegal Mutual and Atlantic States contribute substantially all of their respective premiums, losses and loss expenses to the underwriting pool, and the underwriting pool, acting through Donegal Mutual,
then allocates 80% of the pooled business to Atlantic States. Thus, Donegal Mutual and Atlantic States share the underwriting results of the pooled business in proportion to their respective participation in the underwriting pool.
The member companies of the Donegal Insurance Group, which include our insurance subsidiaries, share a combined business plan to enhance market penetration and underwriting profitability objectives. We believe Donegal
Mutual’s majority interest in the combined voting power of our Class A common stock and of our Class B common stock fosters our ability to implement our business philosophies, enjoy management continuity, maintain superior employee relations and
provide a stable environment within which we can grow our businesses.
The products the member companies of the Donegal Insurance Group offer are generally complementary, which permits the Donegal Insurance Group to offer a broad range of products in a given market and to expand the Donegal
Insurance Group’s ability to service an entire personal lines or commercial lines account. Distinctions within the products the member companies of the Donegal Insurance Group offer generally allow the member companies to manage certain risk segments
through variations in coverage, policy terms and pricing. As a result, the underwriting profitability of the business the individual companies write directly will vary. However, the underwriting pool homogenizes the risk characteristics of all
business that Donegal Mutual and Atlantic States write directly and all business that Donegal Mutual assumes from its affiliates and places into the underwriting pool. The business Atlantic States derives from the underwriting pool represents a
significant percentage of our total consolidated revenues.
As the capital of Atlantic States and our other insurance subsidiaries has increased, the underwriting capacity of our insurance subsidiaries has increased proportionately. The size of the underwriting pool has also
increased substantially. Therefore, as we originally planned in the mid-1980s, Atlantic States has successfully raised the capital necessary to support the growth of its direct business as well as to accept increases in its allocation of business
from the underwriting pool. The portion of the underwriting pool allocated to Atlantic States has increased from an initial allocation of 35% in 1986 to an 80% allocation since March 1, 2008. We do not anticipate any further change in the pooling
agreement between Atlantic States and Donegal Mutual, including any change in the percentage participation of Atlantic States in the underwriting pool.
In addition to Atlantic States, our insurance subsidiaries are Michigan Insurance Company, or MICO, The Peninsula Insurance Company and its wholly owned subsidiary, Peninsula Indemnity Company, or collectively,
Peninsula, and Southern Insurance Company of Virginia, or Southern. Donegal Mutual has a 100% quota-share reinsurance agreement with Southern Mutual Insurance Company, or Southern Mutual, and Donegal Mutual places its assumed business from Southern
Mutual into the underwriting pool. Donegal Mutual wholly owns and has a 100% quota-share reinsurance agreement with Mountain States Indemnity Company and Mountain States Commercial Insurance Company (collectively, the “Mountain States insurance
subsidiaries”), and Donegal Mutual places its assumed business from the Mountain States insurance subsidiaries into the underwriting pool.
The following chart depicts our organizational structure, including all of our property and casualty insurance subsidiaries and affiliates:
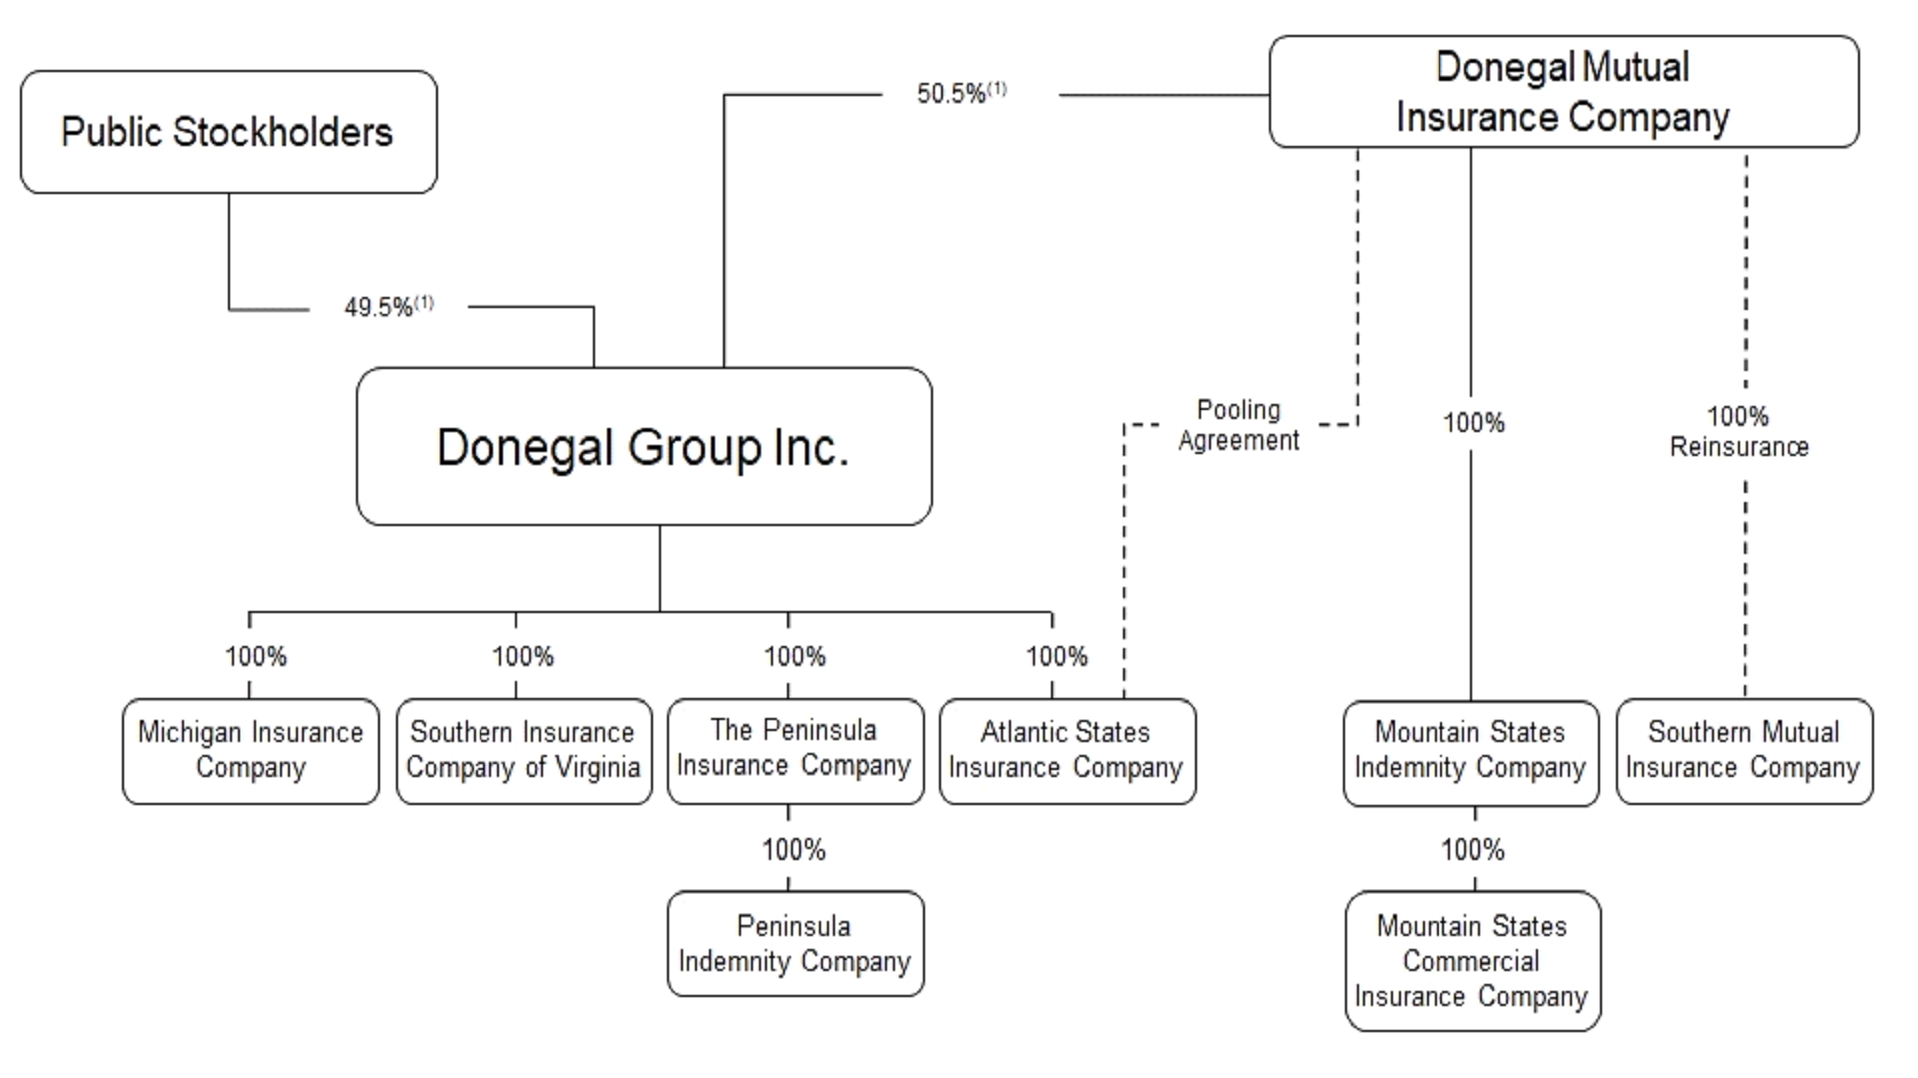
(1) Because of the different relative voting power of our Class A common stock and our Class B common stock, our public stockholders hold approximately 30% of the combined voting power of our Class A common stock and our Class B common
stock and Donegal Mutual holds approximately 70% of the combined voting power of our Class A common stock and our Class B common stock.
Relationship with Donegal Mutual
Donegal Mutual provides facilities, management and other services to us and our insurance subsidiaries. In addition, Donegal Mutual purchases and maintains the information technology systems that support the business of
Donegal Mutual and our insurance subsidiaries. Donegal Mutual allocates certain related expenses to Atlantic States in accordance with the relative participation of Donegal Mutual and Atlantic States in the pooling agreement. Our insurance
subsidiaries other than Atlantic States reimburse Donegal Mutual for allocated costs of services Donegal Mutual provides on their behalf based on their proportion of the total direct premiums written of the Donegal Insurance Group and other metrics.
Allocated expenses from Donegal Mutual for services it provided to Atlantic States and our other insurance subsidiaries totaled $224.8 million, $224.6 million, and $219.0 million for 2025, 2024 and 2023, respectively.
Donegal Mutual is the employer of record for all personnel who provide services for our insurance subsidiaries. Donegal Mutual strives to maintain a culture that is based on integrity and respect, with an environment
designed to facilitate excellent service to the agents and customers of the Donegal Insurance Group. At December 31, 2025, Donegal Mutual had 851 employees, of which 422 were based in its Marietta, Pennsylvania headquarters and 429 were based in
regional offices or were permanent remote employees. There were 831 full-time employees and 20 part-time employees. The majority of Donegal Mutual’s employees follow a hybrid schedule that includes working several days in their assigned office to
allow for enhanced collaboration and interaction with other employees. Donegal Mutual targets employee compensation that is competitive and consistent with an employee’s position, knowledge, experience and skill level. Donegal Mutual provides annual
wage increases that are based on merit. Donegal Mutual provides an annual cash incentive plan for all of its employees that provides an opportunity for Donegal Mutual’s employees to earn a bonus as a percentage of their annual wages that varies based
on the level of underwriting profit Donegal Insurance Group achieves for a calendar year. In addition, Donegal Mutual provides to its full-time employees a comprehensive employee benefits program, including medical, dental and vision insurance, paid
time off, and a 401(k) retirement plan that includes company matching provisions. Donegal Mutual also provides substantial training, development and wellness programs and resources to its employees.
Our insurance subsidiaries have a catastrophe reinsurance agreement with Donegal Mutual, pursuant to which Donegal Mutual provides coverage for losses related to any catastrophic occurrence over a set retention of $3.0
million for each participating insurance subsidiary, with a combined retention of $6.0 million for a catastrophe involving a combination of participating insurance subsidiaries, up to the amount Donegal Mutual and our insurance subsidiaries retain
under catastrophe reinsurance agreements with unaffiliated reinsurers. The purpose of the catastrophe reinsurance agreement is to lessen the effects of an accumulation of losses arising from one event to levels that are appropriate given each
subsidiary’s size, underwriting profile and surplus.
Several of our insurance subsidiaries have a liability reinsurance agreement with Donegal Mutual, pursuant to which Donegal Mutual provides coverage for losses related to any liability claim occurrence over a set
retention of $3.0 million for each participating insurance subsidiary. The purpose of the liability reinsurance agreement is to lessen the effect of a liability loss to a level that is appropriate given each subsidiary’s size, underwriting profile
and surplus.
We and Donegal Mutual have maintained a coordinating committee since our formation in 1986. The coordinating committee consists of two members of our board of directors, neither of whom is a member of Donegal Mutual’s
board of directors, and two members of Donegal Mutual’s board of directors, neither of whom is a member of our board of directors. The purpose of the coordinating committee is to establish and maintain a process for an ongoing evaluation of the
transactions between Donegal Mutual, our insurance subsidiaries and us. The coordinating committee considers the fairness of each intercompany transaction to Donegal Mutual and its policyholders and to us and our stockholders.
A new agreement or any change to a previously approved agreement must receive coordinating committee approval. The approval process for a new agreement between Donegal Mutual and us or one of our insurance subsidiaries
or a change in such an agreement is as follows:
| • |
both of our members on the coordinating committee must determine that the new agreement or the change in an existing agreement is fair and equitable to us and in the best interests of our stockholders;
|
| • |
both of Donegal Mutual’s members on the coordinating committee must determine that the new agreement or the change in an existing agreement is fair and equitable to Donegal Mutual and in the best interests of its policyholders;
|
| • |
our board of directors must approve the new agreement or the change in an existing agreement; and
|
| • |
Donegal Mutual’s board of directors must approve the new agreement or the change in an existing agreement.
|
The coordinating committee also meets annually to review each existing agreement between Donegal Mutual and us or our insurance subsidiaries, including all reinsurance agreements between Donegal Mutual and our
insurance subsidiaries. The purpose of this annual review is to examine the results of the agreements over the past year and, in the case of reinsurance agreements, over several years and to determine if the results of the existing agreements
remain fair and equitable to us and our stockholders and fair and equitable to Donegal Mutual and its policyholders or if Donegal Mutual and we should mutually agree to certain adjustments to the terms of the agreements. In the case of reinsurance
agreements, the annual adjustments take into account reinsurance Donegal Mutual and our insurance subsidiaries obtain from unaffiliated reinsurers and typically relate to the reinsurance premiums and loss retention amounts. These agreements are
ongoing in nature and will continue in effect throughout 2026 in the ordinary course of our business.
Our members on the coordinating committee, as of the date of this Form 10-K Report, are Barry C. Huber and David C. King. Donegal Mutual’s members on the coordinating committee as of such date are Michael W. Brubaker and
Michael K. Callahan. We refer to our proxy statement for our annual meeting of stockholders to be held on April 16, 2026 for further information about the members of the coordinating committee.
We believe our relationships with Donegal Mutual offer us and our insurance subsidiaries a number of competitive advantages, including the following:
| • |
enabling our stable management, the consistent underwriting discipline of our insurance subsidiaries, external growth, long-term profitability and financial strength;
|
| • |
creating operational and expense synergies from the combination of resources and integrated operations of the Donegal Insurance Group;
|
| • |
producing more stable and uniform underwriting results for our insurance subsidiaries over extended periods of time than we could achieve without our relationship with Donegal Mutual;
|
| • |
providing opportunities for growth because of the ability of Donegal Mutual to affiliate and enter into reinsurance agreements with, or otherwise acquire control of, mutual insurance companies and place the business it assumes into the
underwriting pool; and
|
| • |
providing Atlantic States with a significantly larger underwriting capacity because of the underwriting pool Donegal Mutual and Atlantic States have maintained since 1986.
|
In the first quarter of 2026, our board of directors and the board of directors of Donegal Mutual each undertook a review of the relationships between Donegal Mutual and DGI and determined that continuing the current
relationships and the current corporate structure of Donegal Mutual and DGI is in the best interests of DGI and its various constituencies.
Business Strategy
We and Donegal Mutual are focused on several primary strategies, including achieving sustained excellent financial performance, strategically modernizing our operations and processes to transform our business,
capitalizing on opportunities to grow profitably and providing superior experiences to our agents, policyholders and employees. Our strategies are designed to provide financial security to the policyholders of Donegal Mutual and our respective
insurance subsidiaries and, ultimately, to provide value to our stockholders. The annual net premiums earned of our insurance subsidiaries have increased from $301.5 million in 2006 to $921.2 million in 2025, a compound annual growth rate of 6.1%.
The combined ratio of our insurance subsidiaries and that of the United States property and casualty insurance industry as computed using United States generally accepted accounting principles, or GAAP, and statutory
accounting principles, or SAP, for the years 2021 through 2025 are shown in the following table:
|
2025
|
2024
|
2023
|
2022
|
2021
|
||||||||||||||||
|
Our GAAP combined ratio
|
95.4
|
%
|
98.6
|
%
|
104.4
|
%
|
103.3
|
%
|
101.0
|
%
|
||||||||||
|
Our SAP combined ratio
|
95.0
|
98.3
|
104.2
|
103.3
|
100.8
|
|||||||||||||||
|
Industry SAP combined ratio (1)
|
95.0 |
97.1
|
101.9
|
103.1
|
100.0
|
|||||||||||||||
| (1) |
As reported (projected for 2025) by A.M. Best Company.
|
We and Donegal Mutual believe we can continue to expand our insurance operations over time primarily through organic growth. Our insurance subsidiaries and Donegal Mutual seek to increase their premium base by making
quality independent agency appointments, enhancing their competitive position within each agency, providing a comprehensive suite of insurance products and developing and maintaining automated systems to improve service, communications and
efficiency.
A detailed review of our business strategies follows:
| • |
Achieving sustained excellent financial performance.
|
Our insurance subsidiaries seek to achieve excellent financial performance through a combination of consistent investment income and underwriting profitability. Underwriting profitability is a fundamental component of
our long-term financial strength because it allows our insurance subsidiaries to generate profits without relying exclusively on their investment income for profitability.
Our insurance subsidiaries seek to enhance their underwriting results by:
| • |
carefully selecting the product lines, classes of business and individual risks they underwrite;
|
| • |
executing localized strategies to achieve a mix of business they expect will generate targeted margins of profitability;
|
| • |
monitoring premium rate adequacy and adjusting premium rates to achieve targeted growth, returns and retention levels;
|
| • |
utilizing enhanced underwriting and technology tools to inform underwriting decisions and determine coverage availability;
|
| • |
utilizing data analytics and predictive modeling tools to inform risk selection and pricing decisions;
|
| • |
utilizing economic capital modeling tools to carefully manage their risk profile, including the geographic concentration of risks they underwrite; and
|
| • |
evaluating their claims history on a regular basis to ensure the adequacy of their underwriting guidelines and product pricing.
|
Our insurance subsidiaries maintain discipline in their pricing by effecting rate increases to sustain or improve their underwriting results without unduly affecting their customer retention. In addition to appropriate
pricing, our insurance subsidiaries seek to ensure that their premium rates are adequate relative to the risk exposures they insure. Our insurance subsidiaries review loss trends on a regular basis to identify changes in the frequency and severity of
their claims and to assess the adequacy of their rates and underwriting standards. Our insurance subsidiaries utilize integrated risk-specific catastrophe model results, a tool to estimate probable maximum fire loss, embedded building valuation
models and aerial imagery enhanced by artificial intelligence (“AI”) to enhance their review and pricing of commercial property risks. Our insurance subsidiaries also carefully monitor and audit the information they use to price their policies for
the purpose of enabling them to receive an adequate level of premiums for the risk they assume. For example, our insurance subsidiaries audit the payroll data of their workers’ compensation customers to verify that the assumptions used to price a
particular policy were accurate. By implementing appropriate rate increases and understanding the risks our insurance subsidiaries agree to insure, our insurance subsidiaries seek to achieve consistent underwriting profitability.
Our insurance subsidiaries monitor the performance of the product lines they underwrite and the geographies in which they offer their insurance products. Our insurance subsidiaries take specific actions to remediate
underperforming product lines or geographies that include pricing increases, underwriting adjustments, reunderwriting initiatives as well as discontinuing a given product or withdrawing from a geography when our insurance subsidiaries determine they
cannot reasonably expect to generate targeted profitability over time. For example, our insurance subsidiaries exited the commercial lines markets in the states of Georgia and Alabama, including the non-renewal of all commercial lines accounts in
those states, during 2023 and 2024. Our insurance subsidiaries took this action after determining that they could not reasonably expect to generate targeted profitability within a reasonable period of time for commercial lines of business in those
states.
Our insurance subsidiaries have no material exposures to asbestos or environmental liabilities. Our insurance subsidiaries seek to provide more than one policy to a given personal lines or commercial lines customer
because this “account selling” strategy diversifies their risk and has historically improved their underwriting results. Our insurance subsidiaries also use reinsurance to manage their exposure and limit their maximum net loss from large single risks
or risks in concentrated areas.
Our insurance subsidiaries maintain stringent expense controls under direct supervision of their senior management. We centralize the processing and administrative activities of our insurance subsidiaries to realize
operating synergies and better expense control. Our insurance subsidiaries utilize technology to automate much of their underwriting, claims and billing processes and to facilitate agency and policyholder communications on an efficient, timely and
cost-effective basis. During 2024 and 2025, Donegal Mutual and our insurance subsidiaries conducted a formal expense reduction initiative that included actions to optimize staffing levels, take advantage of technology-driven efficiency gains, align
agency compensation to desired outcomes and reduce third-party vendor costs in several operational areas. Various actions will continue into 2026 to achieve targeted expense management goals. Our insurance subsidiaries have increased their annual
premium per employee, a measure of efficiency that our insurance subsidiaries use to evaluate their operations, from approximately $470,000 in 1999 to approximately $1.3 million in 2025.
Return on invested assets is an important element of the financial results of our insurance subsidiaries. The investment strategy of our insurance subsidiaries is to generate an appropriate amount of after-tax income on
invested assets while limiting the potential impact of equity market volatility and minimizing credit risk through investments in high-quality securities. As a result, our insurance subsidiaries seek to invest a high percentage of their assets in
diversified, highly rated and marketable fixed-maturity instruments. The fixed-maturity portfolios of our insurance subsidiaries consist of both taxable and tax-exempt securities. Our insurance subsidiaries maintain a portion of their portfolios in
short-term securities to provide liquidity for the payment of claims and operation of their respective businesses. Our insurance subsidiaries maintain a small percentage (3.0% at December 31, 2025) of their portfolios in equity securities.
| • |
Advancing our operational and digital capabilities.
|
We have an enterprise analytics department that is focused on integrating data and analytics into strategy and decision-making at all levels of our organization. The enterprise analytics team is responsible for core
functions of rate-making, predictive analytics, data management and business intelligence. These responsibilities include the development and expansion of risk-based pricing segmentation, analytical innovation, predictive modeling solutions, formal
data strategies, performance monitoring and enhanced reporting mechanisms. We developed and are executing a pricing and analytics roadmap that will continue to deliver data-driven insights to our underwriters. This roadmap includes ongoing
development and enhancement of quality tools that allow us to operationalize pricing and underwriting predictive models, integrate internal and external data for better-informed pricing and underwriting decisions and enhance the automation and
precision of our rate indication methodology. Our enterprise analytics team is continuing to develop new tools and solutions that are enhancing our product portfolio management capabilities, competitive intelligence, pricing sophistication and
utilization of data to monitor and manage our operations. The team also generates reporting and analyses that enable us to draw business insights from data that drive actions to improve performance.
We are focused on process excellence and are executing a multi-year roadmap for addressing those opportunities. We are also expanding our data management capabilities to continually ensure the data upon which we rely for
our business decisions and financial reporting is complete, accurate and secure. We have assigned an innovation task force the responsibility to research emerging technologies and identify potential technology solutions that might assist us in
achieving our business strategies.
In 2018, Donegal Mutual initiated a multi-year systems modernization project to replace its remaining legacy systems, streamline business processes and workflows and enhance data analytics and modeling capabilities. In
February 2020, Donegal Mutual implemented the first release of new systems related to the project, and our insurance subsidiaries began to issue workers’ compensation policies from the new systems in the second quarter of 2020. In August 2021,
Donegal Mutual implemented the second release of new systems related to the project, including a new agency portal and the rating, underwriting and policy issuance capabilities necessary to support the launch of new personal lines products, and our
insurance subsidiaries began to issue new personal lines products from the new systems in the fourth quarter of 2021. In 2023, Donegal Mutual implemented two additional major releases of new systems, which included three commercial lines of business
with enhanced straight-through-processing capabilities as well as dwelling fire and conversion of legacy homeowners renewal policies in two initial states. In 2024, Donegal Mutual implemented another major release that included dwelling fire and
conversion of legacy homeowners renewal policies in the remaining eight states. In 2025, Donegal Mutual implemented new systems for the remaining lines of business the Donegal Insurance Group issues currently and for the conversion of remaining
legacy renewal policies of the Donegal Insurance Group. Donegal Mutual is converting legacy renewal policies to the new systems on a state-by-state basis, currently projecting full completion in 2027.
In 2023, Donegal Mutual began a multi-year data modernization initiative to implement a comprehensive cloud-based data infrastructure that will support critical future business processes and strategies. This agile
infrastructure will scale dynamically based on business demands and deliver real-time insights. The platform will enable highly efficient data processing through modular, metadata-driven frameworks, ensuring accelerated and reliable future data
delivery within a secure, governed and compliant repository. It will also incorporate robust security features, such as multi-factor authentication and data encryption, as well as other advanced data security and privacy measures. The platform will
also facilitate seamless integration with analytics functions, artificial intelligence and machine learning models, and enable innovative business use cases for technologies such as Generative Artificial Intelligence (“GenAI”). Donegal Mutual
implemented concurrently a formal data management program that aligns critical business processes and strategies with our technology. We expect these data-related investments will ensure easily accessible data for management reporting, position us to
further enhance our data analytics, enable the future addition of new data sources and mitigate data integrity risk.
During 2025, Donegal Mutual conducted a detailed and thorough assessment of the benefits of migrating its on-premises Guidewire claims, billing and policy administration systems to the Guidewire
cloud platform. These benefits include increased agility and faster time-to-market for new product launches and feature enhancements, reduced operational costs and complexity associated with maintaining in-house technology systems, enhanced tools and
capabilities to better empower business users and secure access to a scalable, continuously evolving industry-leading insurance platform to support and enable future growth. With the support of experienced vendor partners, Donegal Mutual developed a
comprehensive migration plan and initiated the first phase of the program in early 2026. The plan calls for the migration of its claims and billing applications to the cloud in early 2027. Migration activities for its policy administration system
will commence closer to completion of legacy policy conversion activities in 2027, with completion of the migration expected in 2028. This phased strategy represents a risk-averse approach to the cloud migration while retaining capacity to deliver
business-critical projects in parallel with those activities.
In 2025, Donegal Mutual continued to explore GenAI capabilities through a combination of targeted third-party vendor engagements and internal development. Progress has been calculated, as Donegal Mutual carefully
evaluated potential use cases and adoption opportunities for this transformative technology. Donegal Mutual has successfully deployed its first GenAI solution into production, with several additional pilot projects nearing completion in 2026. These
solutions are focused on generating efficiencies within operational processes. The insights gained through these early efforts informed its evaluation of the artificial intelligence capabilities within the Guidewire cloud platform. Donegal Mutual
is currently working to co-develop and launch new GenAI solutions to production as part of its claims system cloud migration. These solutions leverage the significant investments Guidewire and other strategic partners are making to deliver GenAI
tools Donegal Mutual expects to seamlessly integrate into the core business systems that support the combined insurance operations of the Donegal Insurance Group.
| • |
Capitalizing on opportunities to grow profitably.
|
Continued expansion of our insurance subsidiaries within their existing markets will be a key source of their continued premium growth, and maintaining an effective network of independent agencies is integral to this
expansion. Our insurance subsidiaries seek to be among the top three insurers within each of the independent agencies for the lines of business our insurance subsidiaries write by providing a consistent, competitive and stable market for their
products. We believe that the consistency of the product offerings of our insurance subsidiaries enables our insurance subsidiaries to compete effectively for independent agents with other insurers whose product offerings may fluctuate based on
industry conditions. Our insurance subsidiaries offer a competitive compensation program to their independent agents that rewards them for producing profitable growth and maintaining profitable books of business with our insurance subsidiaries.
Our insurance subsidiaries execute a combined annual business plan with Donegal Mutual and its insurance subsidiaries. Over the past several years, we enhanced the annual planning process to ensure that we are directing
efforts and resources toward geographic regions, market segments, product lines and classes of business that will give us the best opportunities to achieve sustained growth and profitability. As part of the planning process, we perform a detailed
analysis of internal and external data with respect to each state within our operating regions. We assess state-specific marketing dynamics and opportunities, including an evaluation of the historical experience of our insurance subsidiaries. We then
assign a strategic posture for each state and develop action plans to execute state-specific strategies for growth or reduction of premiums, agency distribution and enhanced profit generation over the next several years. As part of our property
exposure management, we implemented tools that have allowed us to assign a strategic posture at a county level within each state. Our insurance subsidiaries utilize these tools to further manage and refine their concentrations of property risk
exposure and to enhance their geographic risk diversification. We expect this strategy will reduce over time the overall impact of losses from severe weather events to the results of our insurance subsidiaries.
In recent years, the consolidation of independent agencies has accelerated, resulting in the acquisition of independent agencies from which our insurance subsidiaries and Donegal Mutual currently receive business by
national cluster groups and aggregators. We have a dedicated national accounts team that is responsible for the management and expansion of our relationships with these national agency groups. The national accounts team serves as a centralized point
of contact for these groups and works directly with our regional sales and marketing teams to support and develop relationships with independent agents affiliated with national agency groups. We believe our relationships with existing and emerging
national agency groups will continue to expand and that these groups represent a sustainable source of profitable future growth.
| • |
Delivering a superior experience to our agents and policyholders.
|
Donegal Mutual and our insurance subsidiaries strive to maintain technology comparable to that of their larger competitors. “Ease of doing business” is a critically important component of an insurer’s value to an
independent agency. Our insurance subsidiaries provide fully automated underwriting and policy issuance portals that substantially ease data entry and facilitate the quoting and issuance of policies for the independent agents of our insurance
subsidiaries. As a result, applications of the independent agents for our insurance subsidiaries can result in policy issuance without further re-entry of information. These systems also interface with the agency management systems of the independent
agents of our insurance subsidiaries. In addition, we utilize agency relationship management tools to enhance the abilities of our insurance subsidiaries to manage their agency relationships and facilitate their agency communications and
interactions.
Our insurance subsidiaries also provide their independent agents with ongoing support to enable them to better attract and service customers, including:
| • |
training programs;
|
| • |
marketing support;
|
| • |
availability of a personal lines service center that provides comprehensive service for our personal lines policyholders;
|
| • |
availability of a commercial lines small business unit to monitor straight-through processing results and enhance turnaround time for responses to agents for less complicated commercial risks;
|
| • |
availability of a commercial lines service center, which is an optional service enhancement for agencies who prefer that we interact directly with their customers for mid-term policy coverage changes and other service requests; and
|
| • |
accessibility to and regular interactions with marketing and underwriting personnel and senior management of our insurance subsidiaries.
|
Our insurance subsidiaries appoint independent agencies with a strong underwriting and growth track record. We believe that our insurance subsidiaries will drive continued long-term growth by carefully selecting,
motivating and supporting their independent agencies.
We believe that excellent policyholder service is important in attracting new policyholders and retaining existing policyholders. Our insurance subsidiaries work closely with their independent agents to provide a
consistently responsive level of claims service, underwriting and customer support. Our insurance subsidiaries seek to respond expeditiously and effectively to address customer and independent agent inquiries in a number of ways, including:
| • |
availability of a customer call center, secure website and mobile application for claims reporting;
|
| • |
availability of a secure website and mobile application for access to policy information and documents, payment processing and other features;
|
| • |
timely replies to information requests and policy submissions; and
|
| • |
prompt responses to, and processing of, claims.
|
| • |
Acquiring property and casualty insurance companies to augment the organic growth of our insurance subsidiaries.
|
We have been an effective consolidator of smaller “main street” property and casualty insurance companies. We are currently placing less emphasis on pursuing acquisitions because Donegal Mutual and we believe there are
opportunities for profitable organic growth in our desired markets and classes of business within our current geographic footprint. Between 1998 and 2017, we and Donegal Mutual completed seven transactions involving acquisitions of property and
casualty insurance companies or participation in the business of property and casualty insurance companies through Donegal Mutual’s entry into quota-share reinsurance agreements with them. While Donegal Mutual and we generally engage in preliminary
discussions with potential direct or indirect acquisition candidates from time to time, neither Donegal Mutual nor we make any public disclosure regarding a proposed acquisition until Donegal Mutual or we have entered into a definitive acquisition
agreement.
The following table highlights our and Donegal Mutual’s history of insurance company acquisitions and affiliations since 1998:
|
Company Name
|
State of Domicile
|
Year Control Acquired
|
Method of Acquisition/Affiliation
|
||||
|
Southern Heritage Insurance Company (1)
|
Georgia
|
1998
|
Purchase of stock by us in 1998.
|
||||
|
Le Mars Mutual Insurance Company of Iowa and then Le Mars Insurance Company (1)
|
Iowa
|
2002
|
Surplus note investment by Donegal Mutual in 2002; conversion to stock company in 2004; acquisition of stock by us in 2004.
|
||||
|
Peninsula Insurance Group
|
Maryland
|
2004
|
Purchase of stock by us in 2004.
|
||||
|
Sheboygan Falls Mutual Insurance Company and then Sheboygan Falls Insurance Company (1)
|
Wisconsin
|
2007
|
Contribution note investment by Donegal Mutual in 2007; conversion to stock company in 2008; acquisition of stock by us in 2008.
|
||||
|
Southern Mutual Insurance Company (2)
|
Georgia
|
2009
|
Surplus note investment by Donegal Mutual and quota-share reinsurance in 2009.
|
||||
|
Michigan Insurance Company
|
Michigan
|
2010
|
Purchase of stock by us in 2010.
|
||||
|
Mountain States Mutual Casualty Company(3)
|
New Mexico
|
2017
|
Merger with and into Donegal Mutual in 2017.
|
|
(1)
|
To reduce administrative and compliance costs and expenses, these subsidiaries subsequently merged into one of our existing insurance subsidiaries.
|
|
(2)
|
Control acquired by Donegal Mutual.
|
|
(3)
|
Donegal Mutual completed the merger of Mountain States Mutual Casualty Company with and into Donegal Mutual effective May 25, 2017. Donegal Mutual was the surviving company in the merger, and Mountain States
insurance subsidiaries became insurance subsidiaries of Donegal Mutual upon completion of the merger. Donegal Mutual also entered into a 100% quota-share reinsurance agreement with the Mountain States insurance subsidiaries on the merger
date. Beginning with policies effective in 2021, Donegal Mutual places the business of the Mountain States insurance subsidiaries into the underwriting pool.
|
Competition
The property and casualty insurance industry is highly competitive on the basis of both price and service. Numerous companies compete for business in the geographic areas where our insurance subsidiaries operate. Many of
these other insurance companies are substantially larger and have greater financial resources than those of our insurance subsidiaries. In addition, because our insurance subsidiaries and Donegal Mutual market their respective insurance products
exclusively through independent insurance agencies, most of which represent multiple insurance companies, our insurance subsidiaries face competition within agencies, as well as competition to appoint and retain qualified independent agents.
Insurance companies that are substantially larger than our insurance subsidiaries benefit from access to larger pools of data upon which to base their underwriting and pricing decisions as well as realize cost synergies their larger scale affords to
them. Insurance companies that market their products directly to end consumers generally incur lower relative acquisition costs compared to those of our insurance subsidiaries.
Products and Underwriting
We report the results of our insurance operations in two segments: commercial lines of insurance and personal lines of insurance. The commercial lines our insurance subsidiaries write consist primarily of commercial
automobile, commercial multi-peril and workers’ compensation insurance. The personal lines our insurance subsidiaries write consist primarily of private passenger automobile and homeowners insurance. We describe these lines of insurance in greater
detail below:
Commercial
| • |
Commercial automobile — policies that provide protection against liability for bodily injury and property damage arising from automobile accidents and protection against loss from damage to automobiles owned by the insured.
|
| • |
Commercial multi-peril — policies that provide protection to businesses against many perils, usually combining liability and physical damage coverages.
|
| • |
Workers’ compensation — policies employers purchase to provide benefits to employees for injuries sustained during employment. The workers’ compensation laws of each state determine the extent of the coverage we provide.
|
Personal
| • |
Private passenger automobile — policies that provide protection against liability for bodily injury and property damage arising from automobile accidents and protection against loss from damage to automobiles owned by the insured.
|
| • |
Homeowners — policies that provide coverage for damage to residences and their contents from a broad range of perils, including fire, lightning, windstorm and theft. These policies also cover liability of the insured arising from injury to
other persons or their property while on the insured’s property and under other specified conditions.
|
In recent years, we have made intentional investments in systems, products and capabilities to enable us to grow our business profitably. We are executing state-specific strategies that include accelerating commercial
lines growth in states and classes of business where we see opportunities for profitable growth and reducing exposures in states and classes of business we have targeted for profit improvement. While we expect to place greater emphasis on
commercial growth for the foreseeable future, we desire to maintain a profitable book of personal business to provide enhanced stability across our product portfolio and enhance our brand value to our independent agents. Donegal Mutual and our
insurance subsidiaries offer personal lines products in ten states through a modern, user-friendly online agency portal. These products feature comprehensive coverage options, modernized rating methodology, enhanced pricing segmentation,
application of predictive analytical models and utilization of third-party data to augment pricing and risk selection. Due to inflationary pressures on loss costs, we carefully managed personal lines exposure growth in 2024, intentionally slowing
the writing of new personal lines opportunities while implementing premium rate increases throughout the year. In 2025, we wrote a limited amount of new personal lines accounts despite taking various actions to improve the competitiveness of our
new business pricing in several core personal lines states as the year progressed. We plan to continue taking actions in 2026 to allow us to attract new accounts at a targeted level that essentially offsets the impact of natural policy attrition
within our book of business. We are continuing to manage pricing levels and exposures with a goal of maintaining rate adequacy and achieving sustained targeted profitability within our personal lines segment.
The following table sets forth the net premiums written of our insurance subsidiaries by line of insurance for the periods indicated:
|
Year Ended December 31,
|
||||||||||||||||||||||||
|
2025
|
2024
|
2023
|
||||||||||||||||||||||
|
(dollars in thousands)
|
Amount
|
%
|
Amount
|
%
|
Amount
|
%
|
||||||||||||||||||
|
Commercial lines:
|
||||||||||||||||||||||||
|
Automobile
|
$
|
197,949
|
21.9
|
%
|
$
|
184,989
|
19.6
|
%
|
$
|
174,741
|
19.5
|
%
|
||||||||||||
|
Workers’ compensation
|
92,464
|
10.2
|
103,533
|
11.0
|
107,598
|
12.0
|
||||||||||||||||||
|
Commercial multi-peril
|
221,283
|
24.5
|
213,959
|
22.7
|
195,632
|
21.8
|
||||||||||||||||||
|
Other
|
52,295
|
5.7
|
45,439
|
4.9
|
50,458
|
5.7
|
||||||||||||||||||
|
Total commercial lines
|
563,991
|
62.3
|
547,920
|
58.2
|
528,429
|
59.0
|
||||||||||||||||||
|
Personal lines:
|
||||||||||||||||||||||||
|
Automobile
|
208,077
|
23.0
|
243,036
|
25.8
|
215,957
|
24.1
|
||||||||||||||||||
|
Homeowners
|
122,999
|
13.6
|
140,613
|
14.9
|
139,688
|
15.6
|
||||||||||||||||||
|
Other
|
9,760
|
1.1
|
10,712
|
1.1
|
11,623
|
1.3
|
||||||||||||||||||
|
Total personal lines
|
340,836
|
37.7
|
394,361
|
41.8
|
367,268
|
41.0
|
||||||||||||||||||
|
Total business
|
$
|
904,827
|
100.0
|
%
|
$
|
942,281
|
100.0
|
%
|
$
|
895,697
|
100.0
|
%
|
||||||||||||
The commercial lines and personal lines underwriting departments of our insurance subsidiaries evaluate and select those risks that they believe will enable our insurance subsidiaries to achieve an underwriting profit.
Within each of the underwriting departments, our insurance subsidiaries have dedicated product development and management teams responsible for the development of quality products at competitive prices to promote growth and profitability as well as
the enhancement of our current products to meet targeted customer needs.
In order to achieve underwriting profitability on a consistent basis, our insurance subsidiaries:
| • |
assess and select primarily standard and preferred risks;
|
| • |
adhere to disciplined underwriting guidelines;
|
| • |
seek to price risks appropriately based on exposure, risk characteristics, utilization of predictive models and application of underwriting judgment; and
|
| • |
utilize various types of risk management and loss control services.
|
Our insurance subsidiaries also review their existing portfolio of insured accounts to determine whether certain risks or classes of business continue to meet their underwriting guidelines and margin expectations. If a
given account or class of business no longer meets those underwriting guidelines or margin expectations, our insurance subsidiaries will take appropriate action regarding that account or class of business, including raising premium rates or
non-renewing policies to the extent applicable laws and regulations permit.
Distribution
Our insurance subsidiaries market their products primarily in the Mid-Atlantic, Midwestern, Southern and Southwestern regions through approximately 2,000 independent insurance agencies. At December 31, 2025, the Donegal
Insurance Group actively wrote business in 21 states (Arizona, Colorado, Delaware, Georgia, Illinois, Indiana, Iowa, Maryland, Michigan, Nebraska, New Mexico, North Carolina, Ohio, Pennsylvania, South Carolina,
South Dakota, Tennessee, Texas, Utah, Virginia, and Wisconsin). Donegal Mutual includes the business it writes directly and assumes from the Mountain States insurance subsidiaries in five Southwestern states (Arizona, Colorado, New Mexico, Texas and
Utah) in the pooling agreement between Donegal Mutual and Atlantic States. We believe the relationships of our insurance subsidiaries with their independent agents are valuable in identifying, obtaining and retaining profitable business. Our
insurance subsidiaries maintain a stringent agency selection procedure that emphasizes appointing agencies with proven marketing strategies for the development of profitable business, and our insurance subsidiaries only appoint agencies with a strong
underwriting history and potential growth capabilities. Our insurance subsidiaries also regularly evaluate the independent agencies that represent them based on their profitability and performance in relation to the objectives of our insurance
subsidiaries. Our insurance subsidiaries seek to be among the top three insurers within each of their agencies for the lines of business our insurance subsidiaries write.
The following table sets forth the percentage of direct premiums our insurance subsidiaries write, including 80% of the direct premiums Donegal Mutual and Atlantic States include in the underwriting pool, in each of the
states where they conducted a significant portion of their business in 2025:
|
Pennsylvania
|
38.3
|
% |
|
Michigan
|
16.6
|
|
|
Delaware
|
7.0
|
|
|
Maryland
|
6.9
|
|
|
Virginia
|
6.1
|
|
|
Ohio
|
3.8
|
|
|
Indiana
|
2.8
|
|
|
Wisconsin
|
2.5
|
|
|
North Carolina
|
2.4
|
|
|
Texas
|
2.4
|
|
|
Georgia
|
1.9
|
|
|
Other
|
9.3
|
|
|
Total
|
100.0
|
% |
Our insurance subsidiaries employ a number of policies and procedures that we believe enable them to attract, retain and motivate their independent agents. We believe that the consistency of the product offerings of our
insurance subsidiaries enables our insurance subsidiaries to compete effectively for independent agents with other insurers whose product offerings may fluctuate based upon industry conditions. Our multi-year systems modernization project has further
enhanced the ability of our insurance subsidiaries to conduct business with their independent agents and to develop and implement new products. Our insurance subsidiaries have a competitive compensation program for their independent agents that
includes base commissions, growth incentive plans and a profit-sharing plan, under which the independent agents may earn additional commissions based upon the volume of premiums produced and the profitability of the business our insurance
subsidiaries receive from that agency. We have an agency stock purchase plan that allows our independent agents to purchase our Class A common stock at a discount to market prices to further align the interests of our independent agents with the
interests of our stockholders.
Our insurance subsidiaries encourage their independent agents to focus on “account selling,” or serving all of a particular insured’s property and casualty insurance needs, which our insurance subsidiaries believe
generally results in more favorable loss experience than covering a single risk for an individual insured.
As part of the effort of our insurance subsidiaries to maintain acceptable underwriting results, they conduct annual reviews of agencies that have failed to meet their underwriting profitability criteria. The review
process includes an analysis of the underwriting and re-underwriting practices of the agency, the completeness and accuracy of the applications the agency submits, the adequacy of the training of the agency’s staff and the agency’s record of
adherence to the underwriting guidelines and service standards of our insurance subsidiaries. Based on the results of this review process, the marketing and underwriting personnel of our insurance subsidiaries develop, together with the agency, a
plan to improve its underwriting profitability. Our insurance subsidiaries monitor the agency’s compliance with the plan and take other measures as required in the judgment of our insurance subsidiaries, including the termination, to the extent
applicable laws and regulations permit, of agencies that are unable to achieve acceptable underwriting profitability.
Technology
Donegal Mutual owns and manages the technology that our insurance subsidiaries utilize on a daily basis. The technology is comprised of highly integrated agency-facing and back-end processing systems that operate within
an advanced, modernized infrastructure that provides high service levels for performance, reliability, security and availability. Donegal Mutual maintains disaster recovery and backup systems and tests these systems on a regular basis. Our insurance
subsidiaries bear their proportionate share of information services expenses based on their respective percentage of the total net premiums written of the Donegal Insurance Group.
The business strategy and ultimate success of our insurance subsidiaries depends on the effectiveness of efficient and integrated business systems and technology infrastructure. These systems enable our insurance
subsidiaries to provide quality service to agents and policyholders by processing business in a timely and dependable manner, communicate and share data with agents and provide a variety of methods for the payment of premiums. These systems also
allow for the accumulation and analysis of data and information for the management of our insurance subsidiaries. Donegal Mutual is currently in the midst of a multi-year effort to modernize certain of its key infrastructure and applications systems
we describe in more detail under “Business - Business Strategy - Advancing our operational and digital capabilities.”
The modernized proficiency of these integrated technology systems facilitates high service levels for the agents and policyholders of our insurance subsidiaries, increased efficiencies in processing the business of our
insurance subsidiaries and lower operating costs. Key components of these technology systems include agency interface systems, automated policy management systems, a claims processing system and a billing administration system. The agency interface
systems provide our insurance subsidiaries with a comprehensive single source to facilitate data sharing both to and from agents’ systems. The agency interface systems also integrate with our automated policy management systems to provide agents with
an integrated means of generating underwritten quotes and automatically issuing policies that meet the underwriting guidelines of our insurance subsidiaries with limited or no intervention by their personnel. The claims processing system allows our
insurance subsidiaries to process claims efficiently and in an automated environment. The billing administration system allows our insurance subsidiaries to process premium billing and collection efficiently and in an automated environment.
We believe Donegal Mutual’s agency-facing technology systems compare well against those of many national property and casualty insurance carriers in terms of feature capabilities and service levels.
Claims
The management of claims is a critical component of the philosophy of our insurance subsidiaries to achieve underwriting profitability on a consistent basis and is fundamental to the successful operations of our
insurance subsidiaries and their dedication to excellent service. Our senior claims management oversees the claims processing units of each of our insurance subsidiaries to assure consistency in the claims settlement process.
The claims departments of our insurance subsidiaries rigorously manage claims to assure that they settle legitimate claims quickly and fairly and that they identify questionable claims for defense. They provide various
means of claims reporting on a 24-hours a day, seven-days a week basis, including toll-free numbers and electronic reporting through our website and mobile application. The claims departments strive to respond to notifications of claims promptly,
generally within the day reported. By responding promptly to claims, they provide quality customer service and we believe minimize the ultimate cost of the claims. They engage independent adjusters as needed to handle claims in areas in which the
typical volume of claims is not sufficient to justify the hiring of field staff. They also employ private investigators, structural experts and outside legal counsel to supplement their internal staff and to assist in the investigation of claims. Our
insurance subsidiaries have a special investigative unit primarily staffed by former law enforcement officers that attempts to identify and prevent fraud and abuse and to investigate questionable claims.
The management of the claims departments of our insurance subsidiaries develops and implements policies and procedures for the establishment of adequate claim reserves. Our insurance subsidiaries employ an actuarial
staff that regularly reviews their reserves for incurred but not reported claims. The management and staff of the claims departments resolve policy coverage issues, manage and process reinsurance recoveries and handle salvage and subrogation matters.
The litigation and personal injury sections of our insurance subsidiaries manage all claims litigation. Claims above certain thresholds require management review and settlement authorization. Our insurance subsidiaries provide their claims adjusters
reserving and settlement authority based upon their experience and demonstrated abilities. Larger or more complicated claims require consultation and approval of senior claims department management.
Liabilities for Losses and Loss Expenses
Liabilities for losses and loss expenses are estimates at a given point in time of the amounts an insurer expects to pay with respect to incurred policyholder claims based on facts and circumstances the insurer knows at
that point in time. For example, legislative, judicial and regulatory actions may expand coverage definitions, retroactively mandate coverage or otherwise require our insurance subsidiaries to pay losses for damages that their policies explicitly
excluded or did not intend to cover. At the time of establishing its estimates, an insurer recognizes that its ultimate liability for losses and loss expenses will exceed or be less than such estimates. Our insurance subsidiaries base their estimates
of liabilities for losses and loss expenses on assumptions as to future loss trends, expected claims severity, judicial theories of liability and other factors. However, during the loss adjustment period, our insurance subsidiaries may learn
additional facts regarding individual claims, and, consequently, it often becomes necessary for our insurance subsidiaries to refine and adjust their estimates for these liabilities. We reflect any adjustments to the liabilities for losses and loss
expenses of our insurance subsidiaries in our consolidated results of operations in the period in which our insurance subsidiaries make adjustments to their estimates.
Our insurance subsidiaries maintain liabilities for the payment of losses and loss expenses with respect to both reported and unreported claims. Our insurance subsidiaries establish these liabilities for the purpose of
covering the ultimate costs of settling all losses, including investigation and litigation costs. Our insurance subsidiaries base the amount of their liability for reported losses primarily upon a case-by-case evaluation of the type of risk involved,
knowledge of the circumstances surrounding each claim and the insurance policy provisions relating to the type of loss the policyholder incurred. Our insurance subsidiaries determine the amount of their liability for unreported claims and loss
expenses on the basis of historical information by line of insurance. Our insurance subsidiaries account for inflation in the reserving function through analysis of costs and trends and reviews of historical reserving results. Our insurance
subsidiaries monitor their liabilities closely and recompute them periodically using new information on reported claims and a variety of statistical techniques. Our insurance subsidiaries do not discount their liabilities for losses and loss
expenses.
Reserve estimates can change over time because of unexpected changes in assumptions related to our insurance subsidiaries’ external environment and, to a lesser extent, assumptions related to our insurance subsidiaries’
internal operations. For example, our insurance subsidiaries have experienced an increase in claims severity and a lengthening of the claim settlement periods on bodily injury claims during the past several years. In addition, the COVID-19 pandemic
and related government mandates and restrictions resulted in various changes from historical claims reporting and settlement trends during 2020 and resulted in significant increases in loss costs in several following years due to a number of factors,
including supply chain disruption, higher new and used automobile values, increases in the cost of replacement automobile parts and rising labor rates. These trend changes caused significant disruption to historical loss patterns and gave rise to
greater uncertainty as to the pattern of future loss settlements. Uncertainties regarding future trends include social inflation, availability and cost of replacement automobile parts and building materials, availability and cost of skilled labor,
the rate of specialized plaintiff attorney involvement in claims, plaintiff attorney utilization of litigation financing and the cost of medical technologies and procedures. Assumptions related to our insurance subsidiaries’ external environment
include the absence of significant changes in tort law and the legal environment that increase liability exposure, consistency in judicial interpretations of insurance coverage and policy provisions and the rate of loss cost inflation. Internal
assumptions include consistency in the recording of premium and loss statistics, consistency in the recording of claims, payment and case reserving methodology, accurate measurement of the impact of rate changes and changes in policy provisions,
consistency in the quality and characteristics of business written within a given line of business and consistency in reinsurance coverage and collectability of reinsured losses, among other items. To the extent our insurance subsidiaries determine
that underlying factors impacting their assumptions have changed, our insurance subsidiaries make adjustments in their reserves that they consider appropriate for such changes. Accordingly, our insurance subsidiaries’ ultimate liability for unpaid
losses and loss expenses will likely differ from the amount recorded at December 31, 2025. For every 1% change in our insurance subsidiaries’ loss and loss expense reserves, net of reinsurance recoverable, the effect on our pre-tax results of
operations would be approximately $7.1 million.
The establishment of appropriate liabilities is an inherently uncertain process and we can provide no assurance that our insurance subsidiaries’ ultimate liability will not exceed our insurance subsidiaries’ loss and
loss expense reserves and have an adverse effect on our results of operations and financial condition. Furthermore, we cannot predict the timing, frequency and extent of adjustments to our insurance subsidiaries’ estimated future liabilities, because
the historical conditions and events that serve as a basis for our insurance subsidiaries’ estimates of ultimate claim costs may change. As is the case for substantially all property and casualty insurance companies, our insurance subsidiaries have
found it necessary in the past to increase their estimated future liabilities for losses and loss expenses in certain periods and, in other periods, their estimated future liabilities for losses and loss expenses have exceeded their actual
liabilities for losses and loss expenses. Changes in our insurance subsidiaries’ estimates of their liability for losses and loss expenses generally reflect actual payments and their evaluation of information received subsequent to the prior
reporting period. Our insurance subsidiaries recognized a decrease in their liability for losses and loss expenses of prior years of $10.3 million, $15.0 million and $16.7 million in 2025, 2024 and 2023, respectively. Our insurance subsidiaries made
no significant changes in their reserving philosophy or claims management personnel, and they have made no significant offsetting changes in estimates that increased or decreased their loss and loss expense reserves in those years. The 2025
development represented 1.5% of the December 31, 2024 net carried reserves and resulted primarily from lower-than-expected loss emergence in all lines of business except other commercial lines (which is primarily commercial umbrella liability) for
accident years prior to 2025. The majority of the 2025 development related to decreases in the liability for losses and loss expenses of prior years for Southern and Peninsula. The 2024 development represented 2.2% of the December 31, 2023 net
carried reserves and resulted primarily from lower-than-expected loss emergence in the commercial multi-peril, personal automobile and homeowner lines of business, offset partially by higher-than-expected loss emergence in the workers’ compensation
and commercial automobile lines of business, for accident years prior to 2024. The majority of the 2024 development related to decreases in the liability for losses and loss expenses of prior years for Atlantic States and MICO. The 2023 development
represented 2.5% of the December 31, 2022 net carried reserves and resulted primarily from lower-than-expected loss emergence in the personal automobile and commercial automobile lines of business for accident years prior to 2023. The majority of the
2023 development related to decreases in the liability for losses and loss expenses of prior years for Atlantic States and MICO.
Excluding the impact of severe weather events and the COVID-19 pandemic, our insurance subsidiaries have noted stable amounts in the number of claims incurred and the number of claims outstanding at period ends relative
to their premium base in recent years across most of their lines of business. However, the amount of the average claim outstanding has increased gradually over the past several years due to various factors such as increased property and automobile
repair and replacement costs, rising medical loss costs and increased litigation trends. We have also experienced a general slowing of settlement rates in litigated claims and lengthening of repair completion times for property and automobile claims.
Our insurance subsidiaries could have to make further adjustments to their estimates in the future. However, on the basis of our insurance subsidiaries’ internal procedures, which analyze, among other things, their prior assumptions, their experience
with similar cases and historical trends such as reserving patterns, loss payments, pending levels of unpaid claims and product mix, as well as court decisions, economic conditions and public attitudes, we believe that our insurance subsidiaries have
made adequate provision for their liability for losses and loss expenses.
Atlantic States’ participation in the underwriting pool with Donegal Mutual exposes Atlantic States to adverse loss development on the business that Donegal Mutual contributes to the underwriting pool. However, pooled
business represents the predominant percentage of the net underwriting activity of both companies, and Donegal Mutual and Atlantic States share proportionately any adverse risk development relating to the pooled business. The business in the
underwriting pool is homogeneous, and each company has a pro-rata share of the entire underwriting pool. Since the predominant percentage of the business of Atlantic States and Donegal Mutual is pooled and the results shared by each company according
to its participation level under the terms of the pooling agreement, the intent of the underwriting pool is to produce a more uniform and stable underwriting result from year to year for each company than either would experience individually and to
spread the risk of loss between the companies.
Differences between liabilities reported in our financial statements prepared on a GAAP basis and our insurance subsidiaries’ financial statements prepared on a SAP basis result from anticipating salvage and subrogation
recoveries for GAAP but not for SAP. These differences amounted to $36.6 million, $36.0 million and $32.4 million at December 31, 2025, 2024 and 2023, respectively.
The following table sets forth a reconciliation of the beginning and ending GAAP net liability of our insurance subsidiaries for unpaid losses and loss expenses for the periods indicated:
|
|
Year Ended December 31,
|
|||||||||||
|
(in thousands)
|
2025
|
2024
|
2023
|
|||||||||
|
Gross liability for unpaid losses and loss expenses at beginning of year
|
$
|
1,120,985
|
$
|
1,126,157
|
$
|
1,121,046
|
||||||
|
Less reinsurance recoverable
|
416,621
|
437,014
|
451,184
|
|||||||||
|
Cumulative effect of adoption of updated accounting guidance for credit losses at January 1
|
—
|
—
|
1,132
|
|||||||||
|
Net liability for unpaid losses and loss expenses at beginning of year
|
704,364
|
689,143
|
670,994
|
|||||||||
|
Provision for net losses and loss expenses for claims incurred in the current year
|
574,599
|
619,090
|
625,831
|
|||||||||
|
Change in provision for estimated net losses and loss expenses for claims incurred in prior years
|
(10,267
|
)
|
(14,972
|
)
|
(16,653
|
)
|
||||||
|
Total incurred
|
564,332
|
604,118
|
609,178
|
|||||||||
|
Net losses and loss expense payments for claims incurred during:
|
||||||||||||
|
The current year
|
286,140
|
319,196
|
330,290
|
|||||||||
|
Prior years
|
277,360
|
269,701
|
260,739
|
|||||||||
|
Total paid
|
563,500
|
588,897
|
591,029
|
|||||||||
|
Net liability for unpaid losses and loss expenses at end of year
|
705,196
|
704,364
|
689,143
|
|||||||||
|
Plus reinsurance recoverable
|
394,854
|
416,621
|
437,014
|
|||||||||
|
Gross liability for unpaid losses and loss expenses at end of year
|
$
|
1,100,050
|
$
|
1,120,985
|
$
|
1,126,157
|
||||||
The following table sets forth the development of the liability for net unpaid losses and loss expenses of our insurance subsidiaries from 2015 to 2025. Loss data in the table includes business Atlantic States received
from the underwriting pool.
“Net liability at end of year for unpaid losses and loss expenses” sets forth the estimated liability for net unpaid losses and loss expenses recorded at the balance sheet date for each of the indicated years. This
liability represents the estimated amount of net losses and loss expenses for claims arising in the current and all prior years that are unpaid at the balance sheet date, including losses incurred but not reported.
The “Net liability re-estimated as of” portion of the table shows the re-estimated amount of the previously recorded liability based on experience for each succeeding year. The estimate increases or decreases as payments
are made and more information becomes known about the severity of the remaining unpaid claims. For example, the 2015 liability has developed a deficiency after ten years because we expect the re-estimated net losses and loss expenses to be $20.7
million more than the estimated liability we initially established in 2015 of $322.0 million.
The “Cumulative deficiency (excess)” shows the cumulative deficiency or excess at December 31, 2025 of the liability estimate shown on the top line of the corresponding column. A deficiency in liability means that the
liability established in prior years was less than the amount of actual payments and currently re-estimated remaining unpaid liability. An excess in liability means that the liability established in prior years exceeded the amount of actual payments
and currently re-estimated unpaid liability remaining.
The “Cumulative amount of liability paid through” portion of the table shows the cumulative net losses and loss expense payments made in succeeding years for net losses incurred prior to the balance sheet date. For
example, the 2015 column indicates that at December 31, 2025 payments equal to $333.1 million of the currently re-estimated ultimate liability for net losses and loss expenses of $342.7 million had been made.
|
Year Ended December 31,
|
||||||||||||||||||||||||||||||||||||||||||||
|
(in thousands)
|
2015
|
2016
|
2017
|
2018
|
2019
|
2020
|
2021
|
2022
|
2023
|
2024
|
2025
|
|||||||||||||||||||||||||||||||||
|
Net liability at end of year for unpaid losses and loss expenses
|
$
|
322,054
|
$
|
347,518
|
$
|
383,401
|
$
|
475,398
|
$
|
506,906
|
$
|
557,189
|
$
|
626,359
|
$
|
669,862
|
$
|
689,143
|
$
|
704,364
|
$
|
705,196
|
||||||||||||||||||||||
|
Net liability re-estimated as of:
|
||||||||||||||||||||||||||||||||||||||||||||
|
One year later
|
325,043
|
354,139
|
419,032
|
462,466
|
493,961
|
525,981
|
581,538
|
653,209
|
674,171
|
694,097
|
||||||||||||||||||||||||||||||||||
|
Two years later
|
329,115
|
375,741
|
413,535
|
450,862
|
479,927
|
498,724
|
564,326
|
638,428
|
670,481
|
|||||||||||||||||||||||||||||||||||
|
Three years later
|
338,118
|
376,060
|
404,902
|
440,168
|
463,441
|
490,177
|
550,972
|
638,823
|
||||||||||||||||||||||||||||||||||||
|
Four years later
|
339,228
|
372,230
|
398,560
|
432,027
|
459,835
|
480,865
|
545,874
|
|||||||||||||||||||||||||||||||||||||
|
Five years later
|
338,020
|
370,960
|
396,695
|
431,115
|
455,494
|
484,462
|
||||||||||||||||||||||||||||||||||||||
|
Six years later
|
338,200
|
372,346
|
396,748
|
429,865
|
457,859
|
|||||||||||||||||||||||||||||||||||||||
|
Seven years later
|
339,625
|
371,859
|
396,167
|
432,179
|
||||||||||||||||||||||||||||||||||||||||
|
Eight years later
|
340,191
|
372,477
|
398,727
|
|||||||||||||||||||||||||||||||||||||||||
|
Nine years later
|
340,800
|
374,756
|
||||||||||||||||||||||||||||||||||||||||||
|
Ten years later
|
342,742
|
|||||||||||||||||||||||||||||||||||||||||||
|
Cumulative deficiency (excess)
|
20,688
|
27,238
|
15,326
|
(43,219
|
)
|
(49,047
|
)
|
(72,727
|
)
|
(80,485
|
)
|
(31,039
|
)
|
(18,662
|
)
|
(10,267
|
)
|
|||||||||||||||||||||||||||
|
Cumulative amount of liability paid through:
|
||||||||||||||||||||||||||||||||||||||||||||
|
One year later
|
$
|
149,746
|
$
|
163,005
|
$
|
175,883
|
$
|
195,956
|
$
|
172,497
|
$
|
182,223
|
$
|
218,304
|
$
|
260,739
|
$
|
269,701
|
$
|
277,360
|
||||||||||||||||||||||||
|
Two years later
|
228,506
|
250,678
|
276,331
|
275,993
|
276,069
|
297,860
|
346,107
|
405,216
|
430,824
|
|||||||||||||||||||||||||||||||||||
|
Three years later
|
274,235
|
306,338
|
317,447
|
335,310
|
343,912
|
374,043
|
426,648
|
500,744
|
||||||||||||||||||||||||||||||||||||
|
Four years later
|
300,715
|
324,628
|
342,583
|
371,231
|
393,068
|
418,283
|
471,484
|
|||||||||||||||||||||||||||||||||||||
|
Five years later
|
309,630
|
337,946
|
362,061
|
394,251
|
414,690
|
441,368
|
||||||||||||||||||||||||||||||||||||||
|
Six years later
|
315,105
|
349,496
|
372,584
|
404,251
|
429,045
|
|||||||||||||||||||||||||||||||||||||||
|
Seven years later
|
321,777
|
355,809
|
378,937
|
412,667
|
||||||||||||||||||||||||||||||||||||||||
|
Eight years later
|
326,617
|
359,527
|
384,380
|
|||||||||||||||||||||||||||||||||||||||||
|
Nine years later
|
329,651
|
363,581
|
||||||||||||||||||||||||||||||||||||||||||
|
Ten years later
|
333,148
|
|||||||||||||||||||||||||||||||||||||||||||
|
Year Ended December 31,
|
||||||||||||||||||||||||||||||||||||
|
(in thousands)
|
2017
|
2018
|
2019
|
2020
|
2021
|
2022
|
2023
|
2024
|
2025
|
|||||||||||||||||||||||||||
|
Gross liability at end of year
|
$
|
676,672
|
$
|
814,665
|
$
|
869,674
|
$
|
962,007
|
$
|
1,077,620
|
$
|
1,121,046
|
$
|
1,126,157
|
$
|
1,120,985
|
$
|
1,100,050
|
||||||||||||||||||
|
Reinsurance recoverable
|
293,271
|
339,266
|
362,768
|
404,818
|
451,261
|
451,184
|
437,014
|
416,621
|
394,854
|
|||||||||||||||||||||||||||
|
Net liability at end of year
|
383,401
|
475,398
|
506,906
|
557,189
|
626,359
|
669,862
|
689,143
|
704,364
|
705,196
|
|||||||||||||||||||||||||||
|
Gross re-estimated liability
|
678,947
|
752,587
|
787,256
|
868,967
|
924,582
|
1,000,930
|
1,051,463
|
1,079,093
|
||||||||||||||||||||||||||||
|
Re-estimated recoverable
|
280,220
|
320,408
|
329,397
|
384,505
|
378,708
|
362,107
|
380,982
|
384,996
|
||||||||||||||||||||||||||||
|
Net re-estimated liability
|
398,727
|
432,179
|
457,859
|
484,462
|
545,874
|
638,823
|
670,481
|
694,097
|
||||||||||||||||||||||||||||
|
Gross cumulative deficiency (excess)
|
2,275
|
(62,078
|
)
|
(82,418
|
)
|
(93,040
|
)
|
(153,038
|
)
|
(120,116
|
)
|
(74,694
|
)
|
(41,892
|
)
|
|||||||||||||||||||||
Third-Party Reinsurance
Our insurance subsidiaries and Donegal Mutual purchase certain third-party reinsurance on a combined basis. Our insurance subsidiaries use several different reinsurers, all of which, consistent with the requirements of
our insurance subsidiaries and Donegal Mutual, have an A.M. Best rating of A- (Excellent) or better or, with respect to foreign reinsurers, have a financial condition that, in the opinion of our management, is equivalent to a company with at least an
A- (Excellent) rating from A.M. Best.
The external reinsurance our insurance subsidiaries and Donegal Mutual purchased for 2025 included:
| • |
excess of loss reinsurance, under which Donegal Mutual and our insurance subsidiaries recovered losses over a set retention of $4.0 million for all property losses, $6.0 million for all liability losses except workers’ compensation losses
and $3.0 million for all workers’ compensation losses; and
|
| • |
catastrophe reinsurance, under which Donegal Mutual and our insurance subsidiaries recovered 100% of an accumulation of many losses resulting from a single event, including natural disasters, over a set retention of $25.0 million up to
aggregate losses of $200.0 million per occurrence.
|
For property insurance, our insurance subsidiaries had excess of loss reinsurance that provided for coverage of $36.0 million per loss over a set retention of $4.0 million. For
liability insurance, our insurance subsidiaries had excess of loss reinsurance that provided for coverage of $69.0 million per occurrence over a set retention of $6.0 million. For workers’ compensation insurance, our insurance subsidiaries had excess
of loss reinsurance that provided for coverage of $17.0 million on any one life over a set retention of $3.0 million. Our insurance subsidiaries and Donegal Mutual renewed their third-party reinsurance for 2026 with no changes to the coverage and
retention amounts in effect for 2025.
Our insurance subsidiaries and Donegal Mutual also purchased facultative reinsurance to cover certain exposures, including property exposures that exceeded the limits provided by their respective treaty reinsurance.
Investments
At December 31, 2025, 96.4% of all debt securities our insurance subsidiaries held had an investment-grade rating. The investment portfolios of our insurance subsidiaries did not contain any mortgage loans or any
non-performing assets at December 31, 2025.
The following table shows the composition of the debt securities (at carrying value) in the investment portfolios of our insurance subsidiaries, excluding short-term investments, by rating at December 31, 2025:
|
(dollars in thousands)
|
December 31, 2025
|
|||||||
|
Rating(1)
|
Amount
|
Percent
|
||||||
|
U.S. Treasury and U.S. agency securities(2)
|
$
|
548,846
|
38.7
|
%
|
||||
|
Aaa or AAA
|
33,668
|
2.4
|
||||||
|
Aa or AA
|
399,203
|
28.2
|
||||||
|
A
|
208,188
|
14.7
|
||||||
|
BBB
|
177,150
|
12.5
|
||||||
|
BB
|
51,428
|
3.6
|
||||||
|
Allowance for expected credit losses
|
(1,313
|
)
|
(0.1
|
)
|
||||
|
Total
|
$
|
1,417,170
|
100.0
|
%
|
||||
| (1) |
Ratings assigned by Moody’s Investors Services, Inc. or Standard & Poor’s Corporation.
|
| (2) |
Includes mortgage-backed securities of $445.2 million.
|
Our insurance subsidiaries invest in both taxable and tax-exempt securities as part of their strategy to maximize after-tax income. Tax-exempt securities made up approximately 21.3%, 16.6% and 18.2% of the fixed-maturity
securities in the combined investment portfolios of our insurance subsidiaries at December 31, 2025, 2024 and 2023, respectively.
The following table shows the classification of our investments and the investments of our insurance subsidiaries at December 31, 2025, 2024 and 2023 (at carrying value):
|
December 31,
|
||||||||||||||||||||||||
|
2025
|
2024
|
2023
|
||||||||||||||||||||||
|
|
Percent of
|
Percent of
|
Percent of
|
|||||||||||||||||||||
|
(dollars in thousands)
|
Amount
|
Total
|
Amount
|
Total
|
Amount
|
Total
|
||||||||||||||||||
|
Fixed maturities(1):
|
||||||||||||||||||||||||
|
Held to maturity:
|
||||||||||||||||||||||||
|
U.S. Treasury securities and obligations of U.S. government corporations and agencies
|
$
|
79,242
|
5.3 |
%
|
|
$
|
86,579
|
6.3 |
%
|
$
|
91,517
|
6.9 |
%
|
|||||||||||
|
Obligations of states and political subdivisions
|
436,802
|
29.1
|
|
371,896
|
26.9 |
|
376,898
|
28.4 |
|
|||||||||||||||
|
Corporate securities
|
252,099
|
16.8
|
|
236,550
|
17.0 |
|
201,847
|
15.2 |
|
|||||||||||||||
|
Mortgage-backed securities
|
8,304
|
0.6
|
|
10,689
|
0.8 |
|
9,235
|
0.7 |
|
|||||||||||||||
|
Total held to maturity
|
776,447
|
51.8 |
|
705,714
|
51.0 |
|
679,497
|
51.2 |
|
|||||||||||||||
|
Available for sale:
|
||||||||||||||||||||||||
|
U.S. Treasury securities and obligations of U.S. government corporations and agencies
|
24,329
|
1.6 |
|
83,793
|
6.0 |
|
85,419
|
6.4 |
|
|||||||||||||||
|
Obligations of states and political subdivisions
|
48,551
|
3.3 |
|
37,404
|
2.7 |
|
38,116
|
2.9 |
|
|||||||||||||||
|
Corporate securities
|
130,925
|
8.7 |
|
202,932
|
14.7 |
|
196,793
|
14.8 |
|
|||||||||||||||
|
Mortgage-backed securities
|
436,918
|
29.1 |
|
293,763
|
21.2 |
|
269,020
|
20.3 |
|
|||||||||||||||
|
Total available for sale
|
640,723
|
42.7 |
|
617,892
|
44.6 |
|
589,348
|
44.4 |
|
|||||||||||||||
|
Total fixed maturities
|
1,417,170
|
94.5 |
|
1,323,606
|
95.6 |
|
1,268,845
|
95.6 |
|
|||||||||||||||
|
Equity securities(2)
|
44,370
|
3.0 |
|
36,808
|
2.6 |
|
25,903
|
2.0 |
|
|||||||||||||||
|
Short-term investments(3)
|
38,713
|
2.5 |
|
24,558
|
1.8 |
|
32,306
|
2.4 |
|
|||||||||||||||
|
Total investments
|
$
|
1,500,253
|
100.0 |
%
|
|
$
|
1,384,972
|
100.0 |
%
|
$
|
1,327,054
|
100.0 |
%
|
|||||||||||
| (1) |
We refer to Notes 1 and 4 to our Consolidated Financial Statements. We value those fixed maturities we classify as held to maturity at amortized cost; we value those fixed maturities we classify as available for sale at fair value. The
total fair value of fixed maturities we classified as held to maturity was $731.7 million at December 31, 2025, $631.6 million at December 31, 2024 and $611.5 million at December 31, 2023. The amortized cost of fixed maturities we classified
as available for sale was $650.4 million at December 31, 2025, $652.6 million at December 31, 2024 and $629.7 million at December 31, 2023.
|
| (2) |
We value equity securities at fair value. The total cost of equity securities was $27.2 million at December 31, 2025, $24.7 million at December 31, 2024 and $18.8 million at December 31, 2023.
|
| (3) |
We value short-term investments at cost, which approximates fair value.
|
The following table sets forth the maturities (at carrying value) in the fixed maturity portfolio of our insurance subsidiaries at December 31, 2025, 2024 and 2023:
|
December 31,
|
||||||||||||||||||||||||
|
2025
|
2024
|
2023
|
||||||||||||||||||||||
|
|
Percent
of
|
Percent
of
|
Percent
of
|
|||||||||||||||||||||
|
(dollars in thousands)
|
Amount
|
Total
|
Amount
|
Total
|
Amount
|
Total
|
||||||||||||||||||
|
Due in(1):
|
||||||||||||||||||||||||
|
One year or less
|
$
|
28,609
|
2.0
|
% |
|
$
|
56,914
|
4.3
|
% |
|
$
|
54,392
|
4.3
|
% |
|
|||||||||
|
Over one year through three years
|
76,958
|
5.4
|
210,184
|
15.9
|
130,158
|
10.3
|
||||||||||||||||||
|
Over three years through five years
|
140,580
|
9.9
|
175,577
|
13.3
|
141,994
|
11.2
|
||||||||||||||||||
|
Over five years through ten years
|
323,870
|
22.9
|
318,912
|
24.1
|
347,035
|
27.3
|
||||||||||||||||||
|
Over ten years through fifteen years
|
234,181
|
16.6
|
208,445
|
15.7
|
201,585
|
15.9
|
||||||||||||||||||
|
Over fifteen years
|
169,058
|
11.9
|
50,503
|
3.8
|
116,747
|
9.2
|
||||||||||||||||||
|
Mortgage-backed securities
|
445,227
|
31.4
|
304,459
|
23.0
|
278,260
|
21.9
|
||||||||||||||||||
|
Allowance for expected credit losses
|
(1,313
|
)
|
(0.1
|
) |
|
(1,388
|
)
|
(0.1
|
) |
|
(1,326
|
)
|
(0.1
|
) |
|
|||||||||
|
$
|
1,417,170
|
100.0
|
% |
|
$
|
1,323,606
|
100.0
|
% |
|
$
|
1,268,845
|
100.0
|
% |
|
||||||||||
| (1) |
Based on stated maturity dates with no prepayment assumptions. Actual maturities will differ because borrowers may have the right to call or prepay obligations with or without call or prepayment penalties.
|
As shown above, our insurance subsidiaries held investments in mortgage-backed securities having a carrying value of $445.2 million at December 31, 2025. The mortgage-backed securities consist primarily of investments in
governmental agency balloon pools with stated maturities between one and 50 years. The stated maturities of these investments limit the exposure of our insurance subsidiaries to extension risk in the event that interest rates rise and prepayments
decline. Our insurance subsidiaries perform an analysis of the underlying loans when evaluating a mortgage-backed security for purchase, and they select those securities that they believe will provide a return that properly reflects the prepayment
risk associated with the underlying loans.
The following table sets forth the investment results of our insurance subsidiaries for the years ended December 31, 2025, 2024 and 2023:
|
Year Ended December 31,
|
||||||||||||
|
(dollars in thousands)
|
2025
|
2024
|
2023
|
|||||||||
|
Invested assets(1)
|
$
|
1,442,613
|
$
|
1,356,013
|
$
|
1,315,855
|
||||||
|
Investment income(2)
|
52,627
|
44,918
|
40,853
|
|||||||||
|
Average yield
|
3.6
|
%
|
3.3
|
%
|
3.1
|
%
|
||||||
|
Average tax-equivalent yield
|
3.7
|
3.4
|
3.2
|
|||||||||
| (1) |
Average of the aggregate invested amounts at the beginning and end of the period.
|
| (2) |
Investment income is net of investment expenses and does not include investment gains or losses or provision for income taxes.
|
A.M. Best Rating
Donegal Mutual and our insurance subsidiaries have an A.M. Best rating of A (Excellent), based upon the respective current financial condition and historical statutory results of operations of Donegal Mutual and our
insurance subsidiaries. We believe that the A.M. Best rating of Donegal Mutual and our insurance subsidiaries is an important factor in their marketing of their products to their agents and customers. A.M. Best’s ratings are industry ratings based on
a comparative analysis of the financial condition and operating performance of insurance companies. A.M. Best’s classifications are A++ and A+ (Superior), A and A- (Excellent), B++ and B+ (Good), B and B- (Fair), C++ and C+ (Marginal), C and C-
(Weak), D (Poor), E (Under Regulatory Supervision), F (Liquidation) and S (Suspended). A.M. Best bases its ratings upon factors relevant to the payment of claims of policyholders and are not directed toward the protection of investors in insurance
companies. According to A.M. Best, the “Excellent” rating that the Donegal Insurance Group maintains is assigned to those companies that, in A.M. Best’s opinion, have an excellent ability to meet their ongoing insurance obligations.
Regulation
The supervision and regulation of insurance companies consists primarily of the laws and regulations of the various states in which the insurance companies transact business, with the primary regulatory authority being
the insurance regulatory authorities in the state of domicile of the insurance company. Such supervision and regulation relate to numerous aspects of an insurance company’s business and financial condition. The primary purpose of such supervision and
regulation is the protection of policyholders. The authority of the state insurance departments includes the establishment of standards of solvency that insurers must meet and maintain, the licensing of insurers and insurance agents to do business,
the nature of, and limitations on, investments, premium rates for property and casualty insurance, the provisions that insurers must make for current losses and future liabilities, the deposit of securities for the benefit of policyholders, the
approval of policy forms, notice requirements for the cancellation of policies and the approval of certain changes in control. State insurance departments also conduct periodic examinations of the affairs of insurance companies and require the filing
of annual and other reports relating to the financial condition of insurance companies.
In addition to state-imposed insurance laws and regulations, the National Association of Insurance Commissioners, or the NAIC, maintains a risk-based capital system, or RBC, for assessing the adequacy of the statutory
capital and surplus of insurance companies that augments the states’ current fixed dollar minimum capital requirements for insurance companies. At December 31, 2025, our insurance subsidiaries and Donegal Mutual each exceeded the minimum levels of
statutory capital the RBC rules require by a substantial margin.
Generally, every state has guaranty fund laws under which insurers licensed to do business in that state can be assessed on the basis of premiums written by the insurer in that state in order to fund policyholder
liabilities of insolvent insurance companies. Under these laws in general, an insurer is subject to assessment, depending upon its market share of a given line of business, to assist in the payment of policyholder claims against insolvent insurers.
Our insurance subsidiaries and Donegal Mutual have made accruals for their portion of assessments related to such insolvencies based upon the most current information furnished by the guaranty associations.
We are part of an insurance holding company system of which Donegal Mutual is the ultimate controlling person. All of the states in which our insurance companies and Donegal Mutual maintain a domicile have legislation
that regulates insurance holding company systems. Each insurance company in the insurance holding company system must register with the insurance supervisory agency of its state of domicile and furnish information concerning the operations of
companies within the insurance holding company system that may materially affect the operations, management or financial condition of the insurers within the system. Pursuant to these laws, the respective insurance departments in which our
subsidiaries and Donegal Mutual maintain a domicile may examine our insurance subsidiaries or Donegal Mutual at any time, require disclosure of material transactions by the holding company with another member of the insurance holding company system
and require prior notice or prior approval of certain transactions, such as “extraordinary dividends” from the insurance subsidiaries to the holding company. We have insurance subsidiaries domiciled in Michigan, Pennsylvania and Virginia.
The Pennsylvania Insurance Holding Companies Act, which generally applies to Donegal Mutual, us and our insurance subsidiaries, requires that all transactions within an insurance holding company system to which an
insurer is a party must be fair and reasonable and that any charges or fees for services performed must be reasonable. Any management agreement, service agreement, cost sharing arrangement and material reinsurance agreement must be filed with the
Pennsylvania Insurance Department, or the Department, and is subject to the Department’s review. We have filed with the Department the pooling agreement between Donegal Mutual and Atlantic States that established the underwriting pool and all
material agreements between Donegal Mutual and our insurance subsidiaries.
Approval of the applicable insurance commissioner is also required prior to consummation of transactions affecting the control of an insurer. In virtually all states, including the states where our insurance subsidiaries
are domiciled, the acquisition of 10% or more of the outstanding capital stock of an insurer or its holding company or the intent to acquire such an interest creates a rebuttable presumption of a change in control. Pursuant to an order issued in
April 2003, the Department approved Donegal Mutual’s ownership of up to 70% of our outstanding Class A common stock and Donegal Mutual’s ownership of up to 100% of our outstanding Class B common stock.
Our insurance subsidiaries have the legal obligation under state insurance laws to participate in involuntary insurance programs for automobile insurance, as well as other property and casualty insurance lines, in the
states in which they conduct business. These programs include joint underwriting associations, assigned risk plans, fair access to insurance requirements plans, reinsurance facilities, windstorm plans and tornado plans. Legislation establishing these
programs requires all companies that write lines covered by these programs to provide coverage, either directly or through reinsurance, for insureds who are unable to obtain insurance in the voluntary market. The legislation creating these programs
usually allocates a pro rata portion of risks attributable to such insureds to each company on the basis of the direct premiums it has written in that state or the number of automobiles it insures in that state. Generally, state law requires
participation in these programs as a condition to obtaining a certificate of authority. Our loss ratio on insurance we write under these involuntary programs has traditionally been significantly greater than our loss ratio on insurance we voluntarily
write in those states.
Regulatory requirements, including RBC requirements, may impact our insurance subsidiaries’ ability to pay dividends. The amount of statutory capital and surplus necessary for our insurance subsidiaries to satisfy
regulatory requirements, including RBC requirements, was not significant in relation to our insurance subsidiaries’ statutory capital and surplus at December 31, 2025. Generally, the maximum amount that one of our insurance subsidiaries may pay to us
as ordinary dividends during any year after notice to, but without prior approval of, the insurance commissioner of its domiciliary state is limited to a stated percentage of that subsidiary’s statutory capital and surplus at December 31 of the
preceding fiscal year or the net income of that subsidiary for its preceding fiscal year. Our insurance subsidiaries paid dividends to us of $10.0 million,$15.0 million and $13.0 million in 2025, 2024 and 2023, respectively. At December 31, 2025, the
amount of ordinary dividends our insurance subsidiaries could pay to us during 2026, without the prior approval of their respective domiciliary insurance commissioners, is shown in the following table.
|
Name of Insurance Subsidiary
|
Ordinary Dividend Amount
|
|||
|
Atlantic States
|
$
|
50,777,668
|
||
|
MICO
|
10,179,273
|
|||
|
Peninsula
|
5,395,109
|
|||
|
Southern
|
—
|
|||
|
Total
|
$
|
66,352,050
|
||
Donegal Mutual Insurance Company
Donegal Mutual organized as a mutual fire insurance company in Pennsylvania in 1889. At December 31, 2025, Donegal Mutual had admitted assets of $822.2 million and policyholders’ surplus of $454.6 million. At December
31, 2025, Donegal Mutual had total liabilities of $367.6 million, including reserves for net losses and loss expenses of $150.1 million and unearned premiums of $72.4 million. Donegal Mutual’s investment portfolio of $622.8 million at December 31,
2025 consisted primarily of investment-grade bonds of $203.2 million and its investment in our Class A common stock and our Class B common stock. At December 31, 2025, Donegal Mutual owned 13,928,704 shares, or approximately 44%, of our Class A
common stock, which Donegal Mutual carried on its books at $208.7 million, and 4,751,974 shares, or approximately 85%, of our Class B common stock, which Donegal Mutual carried on its books at $71.2 million. We present Donegal Mutual’s financial
information in accordance with SAP as the NAIC Accounting Practices and Procedures Manual requires. Donegal Mutual does not, nor is it required to, prepare financial statements in accordance with GAAP.
Information about Our Executive Officers
The following table sets forth information regarding the executive officers of Donegal Mutual and the Registrant as of the date of this Form 10-K Report:
|
Name
|
Age
|
Position
|
||
|
Kevin G. Burke
|
60
|
President and Chief Executive Officer of us since 2015; President and Chief Executive Officer of Donegal Mutual since 2018; Executive Vice President and Chief Operating Officer of Donegal Mutual from 2014 to
2018; Senior Vice President of Human Resources of Donegal Mutual and us from 2005 to 2014; other positions from 2000 to 2005.
|
||
|
W. Daniel DeLamater
|
53
|
Executive Vice President and Chief Operating Officer of Donegal Mutual and us since 2024; Senior Vice President of us from 2022 to 2024; Senior Vice President and Head of Field Operations & National Accounts of Donegal Mutual from
2022 to 2024; Senior Vice President of National Accounts for Donegal Mutual from 2020 to 2022; President of Southern Mutual Insurance Company since 2016; other positions at Southern Mutual Insurance Company from 2000 to 2016.
|
||
|
Jeffery T. Hay
|
51
|
Executive Vice President and Chief Underwriting Officer of Donegal Mutual and us since 2025; Senior Vice President and Chief Underwriting Officer of Donegal Mutual and Senior Vice President of us from 2021 to
2025; Senior Director of Willis Towers Watson from 2018 to 2021; Head of Personal Lines Product Management of The Hartford from 2015 to 2018; other positions at The Hartford from 2005 to 2015.
|
||
|
Jeffrey D. Miller
|
61
|
Executive Vice President and Chief Financial Officer of Donegal Mutual and us since 2014; Senior Vice President and Chief Financial Officer of Donegal Mutual and us from 2005 to 2014; other positions from
1993 to 2005.
|
||
|
Sanjay Pandey
|
59
|
Executive Vice President and Chief Information Officer of Donegal Mutual and us since 2025; Senior Vice President and Chief Information Officer of Donegal Mutual and us from 2013 to 2025; other positions from
2000 to 2013.
|
||
|
Kristi S. Altshuler
|
45
|
Senior Vice President and Chief Analytics Officer of us since 2020; Senior Vice President and Chief Analytics Officer of Donegal Mutual since 2019; Director of Willis Towers Watson from 2018 to 2019; Director
of Pricing Innovation of USAA from 2014 to 2018; other positions at USAA from 2001 to 2014.
|
||
|
David B. Bawel
|
39
|
Senior Vice President and Chief Accounting Officer of Donegal Mutual and us since 2024; Vice President of Financial Reporting and Analysis of Donegal Mutual and Vice President of us from 2018 to 2024;
Assistant Vice President of Internal Audit of Donegal Mutual from 2012 to 2018.
|
||
|
Noland R. Deas, Jr.
|
58
|
Senior Vice President of Field Operations & National Accounts of Donegal Mutual and Senior Vice President of us since 2024; Senior Regional Vice President of Donegal Mutual from 2022 to 2024 and Regional
Vice President of Donegal Mutual from 2020 to 2022; other positions with Donegal Mutual from 2006 to 2020.
|
||
|
William A. Folmar
|
67
|
Senior Vice President of Claims of Donegal Mutual and Senior Vice President of us since 2019; Vice President of Claims of Donegal Mutual from 2010 to 2019; other positions from 1998 to 2010.
|
||
|
Rick J. Hecker
|
38
|
Senior Vice President and General Counsel of Donegal Mutual and us since 2025; Senior Vice President and General Counsel of Conestoga Title Insurance Company from 2022 to 2024; Vice President and General
Counsel of Conestoga Title Insurance Company from 2021 to 2022.
|
||
|
Christina M. Hoffman
|
51
|
Senior Vice President and Chief Risk Officer of Donegal Mutual and us since 2019; Senior Vice President of Internal Audit of Donegal Mutual and Senior Vice President of us from 2013 to 2019; Vice President of
Internal Audit of Donegal Mutual and Vice President of us from 2009 to 2013.
|
||
|
David W. Sponic
|
61
|
Senior Vice President of Personal Lines of Donegal Mutual and Senior Vice President of us since 2022; Vice President of Personal Lines of Donegal Mutual from 2008 to 2022; other positions from 1990 to 2008.
|
||
|
V. Anthony Viozzi
|
52
|
Senior Vice President and Chief Investment Officer of Donegal Mutual and us since 2012; Vice President of Investments of Donegal Mutual and us from 2007 to 2012.
|
Cautionary Statement Regarding Forward-Looking Statements
This Form 10-K Report and the documents we incorporate by reference in this Form 10-K Report contain “forward-looking statements” within the meaning of the Private Securities Litigation Reform Act of 1995. These
forward-looking statements include certain discussions relating to underwriting, premium and investment income volumes, business strategies, reserves, profitability, our expense reduction initiatives, Donegal Mutual’s ongoing information systems
and data modernization implementations, business relationships and our other business activities during 2025 and beyond. In some cases, you can identify forward-looking statements by terms such as “may,” “will,” “should,” “could,” “would,”
“expect,” “plan,” “intend,” “anticipate,” “believe,” “estimate,” “objective,” “project,” “predict,” “potential,” “goal” and similar expressions. These forward-looking statements reflect our current views about future events and our current
assumptions, and are subject to known and unknown risks and uncertainties that may cause our results, performance or achievements to differ materially from those we anticipate or imply by our forward-looking statements. We cannot control or predict
many of the factors that could determine our future financial condition or results of operations. Such factors may include those we describe under “Risk Factors.” The forward-looking statements contained in this Form 10-K Report reflect our views
and assumptions only as of the date of this Form 10-K Report. Except as required by law, we do not intend to update, and we assume no responsibility for updating, any forward-looking statements we have made. We qualify all of our forward-looking
statements by these cautionary statements.
Risk Factors
Risks Relating to the Property and Casualty Insurance Industry
Industry trends, such as increasing loss severity due to higher rates of litigation against the insurance industry and individual insurers, the willingness of courts to expand
covered causes of loss, rising jury awards, escalating medical, automobile and property repair costs and other factors may contribute to increased costs and result in ultimate loss settlements that exceed the reserves of our insurance subsidiaries.
Loss severity in the property and casualty insurance industry has increased in recent years, principally driven by factors such as distracted driving, larger court judgments, higher jury awards and increasing medical
and automobile and property repair costs, including increases due to inflation and supply chain disruption. In particular, future cost volatility for automobile replacement costs and repair parts could occur because of exposure to governmental
trade policies, including tariffs, or geopolitical events. In addition, many classes of complainants have brought legal actions and proceedings, some of which may be funded by third-party litigation financing, that tend to increase the size of
judgments. The propensity of policyholders and third-party claimants to utilize specialized plaintiff firms and litigate and the willingness of courts to expand causes of loss and the size of awards, to eliminate exclusions and to increase
coverage limits may result in ultimate settlements of current and future losses that exceed the loss reserves of our insurance subsidiaries.
Our insurance subsidiaries are subject to catastrophe losses and losses from other severe weather events, which are unpredictable and may adversely affect our results of
operations, liquidity and financial condition.
The underwriting results of our insurance subsidiaries are subject to weather and other conditions that may adversely affect our financial condition, liquidity or results of operations. Because the occurrence and
severity of catastrophes are inherently unpredictable and may vary significantly from year to year and region to region, our historical results of operations may not be indicative of our future results of operations. Our property and casualty
insurance operations expose us to claims arising from catastrophic events affecting multiple policyholders. Such catastrophic events consist of various natural disasters, including, but not limited to, hurricanes, tropical storms, tornadoes,
windstorms, hailstorms, fires and wildfires, flooding, landslides, earthquakes, severe winter weather events and man-made disasters such as terrorist attacks, explosions and infrastructure failures. Historically, our insurance subsidiaries have
experienced weather-related losses from hurricanes and tropical storms in Mid-Atlantic and Southern states, tornadoes and hailstorms in Mid-Atlantic, Midwestern and Southern states and severe winter weather events in Mid-Atlantic and Midwestern
states.
Losses from catastrophic events are a function of both the extent of our insurance subsidiaries’ exposures, the frequency and severity of the events themselves and the level of reinsurance coverage our insurance
subsidiaries purchase. The increased frequency and severity of weather-related catastrophes and other losses, such as from wildfires and flooding, incurred by the industry in recent years may be indicative of changing weather patterns due to
climate change. Should those patterns continue to emerge, increased weather-related catastrophes in the states in which our insurance subsidiaries operate would lead to higher overall losses that they may be unable to offset through pricing
actions.
Our insurance subsidiaries seek to reduce their exposure to catastrophe losses through their underwriting strategies and their purchase of catastrophe reinsurance. Advancements in economic capital modeling and
catastrophe risk modeling assist our insurance subsidiaries in measuring risk concentrations and inform their reinsurance purchase decisions. Nevertheless, reinsurance may prove inadequate under certain circumstances. While the emerging science
regarding climate change and its connection to extreme weather events continues to be studied, climate change, to the extent it produces rising temperatures and changes in weather patterns, could affect the frequency and severity of weather events
and other losses and thus impact the affordability and availability of catastrophe reinsurance coverage for our insurance subsidiaries. Our insurance subsidiaries’ ability to appropriately manage catastrophe risk depends partially on catastrophe
models, which may be affected by inaccurate or incomplete data, the uncertainty of the frequency and severity of future events and the uncertain impact of changing climate conditions that tend to occur gradually over time.
Changing climate conditions could lead to new or revised regulations with which our insurance subsidiaries would have to comply. Such regulations could impact the ability of our insurance subsidiaries to manage their
exposures in areas impacted by increased weather activity, require our insurance companies to alter the terms and conditions of their policies or impact the ability of our insurance subsidiaries to obtain sufficient pricing increases to offset
higher loss activity.
Our insurance subsidiaries must establish premium rates and loss and loss expense reserves from forecasts of the ultimate costs they expect will arise from risks underwritten
during the policy period, and the profitability of our insurance subsidiaries could be adversely affected if their premium rates or reserves are insufficient to satisfy their ultimate costs.
One of the distinguishing features of the property and casualty insurance industry is that it prices its products before it knows its costs, since insurers generally establish their premium rates before they know the
amount of losses they will incur. Accordingly, our insurance subsidiaries establish premium rates from forecasts of the ultimate costs they expect to arise from risks they have underwritten during the policy period. Proposed increases in premium
rates are subject to regulatory approval on a state-by-state basis, and there is a lag between the time that our insurance subsidiaries file for such approval and the date upon which our insurance subsidiaries can implement any such approved
premium rate increase across their book of business for a product in a particular state. The premium rates our insurance subsidiaries charge may not be sufficient to cover the ultimate losses they incur. Further, our insurance subsidiaries must
establish reserves for losses and loss expenses as balance sheet liabilities based upon estimates involving actuarial and statistical projections at a given time of what our insurance subsidiaries expect their ultimate liability to be. Significant
periods of time often elapse between the occurrence of an insured loss, the reporting of the loss and the settlement of that loss. It is possible that our insurance subsidiaries’ ultimate liability could exceed these estimates because of the future
development of known losses, the existence of losses that have occurred but are currently unreported and larger than historical settlements of pending and unreported claims. The process of estimating reserves is inherently judgmental and can be
influenced by a number of factors, including the following:
| • |
trends in claim frequency and severity;
|
| • |
changes in operations;
|
| • |
emerging economic and social trends;
|
| • |
economic and social inflation;
|
|
•
|
the level of insurance fraud; and
|
| • |
changes in the regulatory and litigation environments.
|
If our insurance subsidiaries determine that their reserves are insufficient to cover their ultimate liability, they will increase their reserves. An increase in reserves results in an increase in losses and a
reduction in net income for the period in which our insurance subsidiaries recognize a deficiency in reserves. Accordingly, an increase in reserves may adversely impact the business, liquidity, financial condition and results of operations of our
insurance subsidiaries.
The financial results of our insurance subsidiaries depend primarily on their ability to underwrite risks effectively and to charge adequate rates to policyholders.
The financial condition, cash flows and results of operations of our insurance subsidiaries depend on their ability to underwrite and set rates accurately for a full spectrum of risks across a number of lines of
insurance. Rate adequacy is necessary to generate sufficient premium to pay losses, loss adjustment expenses and underwriting expenses and to realize a profit.
The ability to underwrite and set rates effectively is subject to a number of risks and uncertainties, including those related to:
| • |
the availability of sufficient, reliable data;
|
| • |
the ability to conduct a complete and accurate analysis of available data;
|
| • |
the ability to recognize in a timely manner changes in trends and to project both the severity and frequency of losses with reasonable accuracy;
|
| • |
uncertainties generally inherent in estimates and assumptions;
|
| • |
the ability to project changes in certain operating expense levels with reasonable certainty;
|
| • |
the development, selection and application of appropriate rating formulae or other pricing methodologies;
|
| • |
the effective development, governance and appropriate use of modeling tools to assist with correctly and consistently achieving the intended results in underwriting and pricing;
|
| • |
the ability to innovate with new pricing strategies and the success of those innovations upon implementation;
|
| • |
the ability to secure regulatory approval of premium rates on an adequate and timely basis;
|
| • |
the ability to predict policyholder retention accurately;
|
| • |
unanticipated court decisions, legislation or regulatory action;
|
| • |
unanticipated changes in our claim settlement practices;
|
| • |
changes in driving patterns for auto exposures;
|
| • |
changes in weather patterns for property exposures;
|
| • |
changes in the medical sector of the economy that impact bodily injury loss costs;
|
| • |
changes in new and used car prices, auto repair costs and auto parts prices, including the increasing integration of sophisticated technology-related components;
|
| • |
the impact of emerging technologies, including driver assistance technologies and autonomous vehicles, on pricing, insurance coverages and loss costs;
|
| • |
the impact of inflation and other factors on the cost and availability of construction materials and labor;
|
| • |
the impact of medical advances on the cost and duration of bodily injury claims;
|
| • |
the ability to monitor property concentration in catastrophe-prone areas, such as hurricane, earthquake, wildfire and wind/hail regions; and
|
| • |
the general state of the economy in the states in which our insurance subsidiaries operate.
|
Such risks may result in our insurance subsidiaries basing their premium rates on inadequate or inaccurate data or inappropriate assumptions or methodologies and may cause our estimates of future changes in the
frequency or severity of claims to be incorrect. As a result, our insurance subsidiaries could underprice risks, which would negatively affect our margins, or our insurance subsidiaries could overprice risks, which could reduce their premium volume
and competitiveness. In either event, underpricing or overpricing risks could adversely impact our operating results, financial condition and cash flows.
We face risks associated with technological change, including artificial intelligence, data modernization and cloud migration, and the profitability of our insurance subsidiaries
could be adversely affected if their competitors deploy such technologies more effectively or at greater scale.
The insurance industry is undergoing rapid technological change, including the expanded use of artificial intelligence, machine learning, advanced analytics, process automation and GenAI. Since 2018, Donegal Mutual has
undertaken a multi-year modernization of its core systems, including replacement of legacy policy administration systems, implementation of a cloud-based data infrastructure and, beginning in 2026, migration of its Guidewire claims, billing and
policy administration systems to the Guidewire cloud platform. Donegal Mutual has also begun deploying and piloting certain GenAI-enabled solutions to provide operating efficiencies and data-driven insights.
These initiatives involve significant cost, operational complexity and reliance on third-party vendors. They may result in implementation delays, cost overruns, data migration errors, system integration challenges,
cybersecurity vulnerabilities, service disruptions or diversion of management attention. These initiatives may not be completed as planned or achieve intended operational efficiencies or other benefits. Any disruption or failure could adversely
affect the underwriting, billing or claims operations of our insurance subsidiaries and materially adversely affect our results of operations and financial condition.
In addition, competitors, including larger insurers and technology-enabled companies, may have greater financial resources, broader data assets and more advanced analytical capabilities, enabling them to develop and
scale artificial intelligence, automation and cloud-based solutions more rapidly or effectively than our insurance subsidiaries can. If competitors more effectively utilize technology to enhance risk selection, refine pricing, reduce expenses,
improve claims handling or strengthen customer and agent experience, they may achieve superior underwriting performance or market share. More sophisticated use of data and analytics by competitors could also increase adverse selection risks for
insurers with comparatively less advanced capabilities.
Our increasing reliance on third-party cloud platforms and technology providers exposes our insurance subsidiaries to vendor dependency and concentration risks. Any service disruption, cybersecurity incident or
strategic misalignment involving a key vendor could impair the operations of our insurance subsidiaries or increase their costs.
The use of artificial intelligence and GenAI presents additional operational, regulatory and reputational risks. Artificial intelligence models may produce inaccurate or unintended results, and evolving legal and
regulatory standards governing artificial intelligence, data usage and algorithmic decision-making may increase compliance costs or restrict certain practices. Use of GenAI may also create unforeseen exposures or coverage issues under the
policies our insurance subsidiaries issue or introduce new forms of claims fraud or cybercrime. If our insurance subsidiaries are unable to adapt to technological developments or compete effectively with organizations that deploy such
technologies at greater scale, their competitive position and financial performance could be materially adversely affected.
Loss or significant restriction of the use of specific rating attributes, analytical models or technologies in the pricing and underwriting of insurance products by our insurance
subsidiaries could adversely affect their future profitability.
Our insurance subsidiaries consider a variety of rating attributes in making risk selection and pricing decisions for personal lines insurance products where allowed by state law. There is increasing regulatory debate
as to whether use of certain rating attributes is unfairly discriminatory. For example, consumer groups and regulators often call for the prohibition or restriction on the use of credit scoring in underwriting and pricing. In addition, there is
increasing regulatory attention on the governance over and use of analytical models and technologies, including artificial intelligence systems, to ensure that such technologies comply with laws that address unfair trade practices and unfair
discrimination. Laws or regulations that significantly curtail the use of specific rating attributes or other analytical models and technologies in the underwriting process could reduce the future profitability of our insurance subsidiaries.
Changes in applicable insurance laws or regulations or changes in the way insurance regulators administer those laws or regulations could adversely affect the operating
environment of our insurance subsidiaries and increase their exposure to loss or put them at a competitive disadvantage.
Property and casualty insurers are subject to extensive supervision in their domiciliary states and in the states in which they do business. This regulatory oversight includes matters relating to:
| • |
licensing and examination;
|
| • |
approval of premium rates;
|
| • |
market conduct;
|
| • |
policy forms;
|
| • |
limitations on the nature and amount of certain investments;
|
| • |
claims practices;
|
| • |
mandated participation in involuntary markets and guaranty funds;
|
| • |
reserve adequacy;
|
| • |
insurer solvency;
|
| • |
transactions between affiliates;
|
| • |
the amount of dividends that insurers may pay; and
|
| • |
restrictions on underwriting standards.
|
Such regulation and supervision are primarily for the benefit and protection of policyholders rather than stockholders.
The NAIC and state insurance regulators re-examine existing laws and regulations from time to time, specifically focusing on areas such as:
| • |
insurance company investments;
|
| • |
issues relating to the solvency of insurance companies;
|
| • |
risk-based capital guidelines;
|
| • |
restrictions on the terms and conditions included in insurance policies;
|
| • |
certain methods of accounting;
|
| • |
reserves for unearned premiums, losses and other purposes;
|
| • |
the values at which insurance companies may carry investment securities and the definition of other-than-temporary impairment of investment securities; and
|
| • |
interpretations of existing laws and the development of new laws.
|
Changes in state laws and regulations, as well as changes in the way state regulators view related-party transactions in particular, could change the operating environment of our insurance subsidiaries and have an
adverse effect on their business.
Insurance companies are subject to assessments, based on their market share in a given line of business, to assist in the payment of unpaid claims and related costs of insolvent
insurance companies. Such assessments could adversely affect the financial condition of our insurance subsidiaries.
Our insurance subsidiaries are subject to assessments pursuant to the guaranty fund laws of the various states in which they conduct business. Generally, under these laws, our insurance subsidiaries can be assessed,
depending upon the market share of our insurance subsidiaries in a given line of insurance business, to assist in the payment of unpaid claims and related costs of insolvent insurance companies in those states. We cannot predict the number and
magnitude of future insurance company failures in the states in which our insurance subsidiaries conduct business, but future assessments could adversely affect the business, financial condition and results of operations of our insurance
subsidiaries.
Risks Relating to Our Business
Our insurance subsidiaries and Donegal Mutual currently conduct business in a limited number of states, with a concentration of business in Pennsylvania, Michigan, Delaware,
Maryland and Virginia. Any single catastrophe occurrence or other condition affecting losses in these states could adversely affect the results of operations of our insurance subsidiaries.
Our insurance subsidiaries and Donegal Mutual conduct business in 21 states located primarily in the Mid-Atlantic, Midwestern, Southern and Southwestern regions of the country. A substantial portion of their business
consists of private passenger and commercial automobile, homeowners, commercial multi-peril and workers’ compensation insurance in Pennsylvania, Michigan, Delaware, Maryland and Virginia. While our insurance subsidiaries and Donegal Mutual
actively manage their respective exposure to catastrophes through their underwriting processes and the purchase of reinsurance, a single catastrophic occurrence, destructive weather pattern, general economic trend, terrorist attack, regulatory
development or other condition affecting one or more of the states in which our insurance subsidiaries conduct substantial business could materially adversely affect their business, financial condition and results of operations. Common
catastrophic events include hurricanes, earthquakes, tornadoes, wind and hailstorms, fires and wildfires, explosions and severe winter storms.
If the independent agents who market the products of our insurance subsidiaries and Donegal Mutual do not maintain their current levels of premium writing with us and Donegal
Mutual, fail to comply with established underwriting guidelines of our insurance subsidiaries and Donegal Mutual or otherwise inappropriately market the products of our insurance subsidiaries and Donegal Mutual, the business, financial condition
and results of operations of our insurance subsidiaries could be adversely affected.
Our insurance subsidiaries and Donegal Mutual market their insurance products solely through a network of approximately 2,000 independent insurance agencies. This agency distribution system is one of the most important
components of the competitive profile of our insurance subsidiaries and Donegal Mutual. As a result, our insurance subsidiaries and Donegal Mutual depend to a material extent upon their independent agents, each of whom has the authority to bind one
or more of our insurance subsidiaries or Donegal Mutual to insurance coverage. To the extent that such independent agents’ marketing efforts fail to result in the maintenance of their current levels of volume and quality or they bind our insurance
subsidiaries or Donegal Mutual to unacceptable insurance risks, fail to comply with the established underwriting guidelines of our insurance subsidiaries and Donegal Mutual or otherwise inappropriately market the products of our insurance
subsidiaries and Donegal Mutual, the business, financial condition and results of operations of our insurance subsidiaries could suffer.
The business of our insurance subsidiaries and Donegal Mutual may not continue to grow and may be materially adversely affected if our insurance subsidiaries and Donegal Mutual
cannot retain existing, and attract new, independent agents or if insurance consumers increase their use of insurance distribution channels other than independent agents.
The ability of our insurance subsidiaries and Donegal Mutual to retain existing, and to attract new, independent agents is essential to the continued growth of the business of our insurance subsidiaries and Donegal
Mutual. If independent agents find it easier to do business with the competitors of our insurance subsidiaries and Donegal Mutual, our insurance subsidiaries and Donegal Mutual could find it difficult to retain their existing business or to attract
new business. While our insurance subsidiaries and Donegal Mutual believe they maintain good relationships with the independent agents they have appointed, our insurance subsidiaries and Donegal Mutual cannot be certain that these independent
agents will continue to sell the products of our insurance subsidiaries and Donegal Mutual to the consumers these independent agents represent. Some of the factors that could adversely affect the ability of our insurance subsidiaries and Donegal
Mutual to retain existing, and attract new, independent agents include:
| • |
the significant competition among insurance companies to attract independent agents;
|
| • |
the labor-intensive and time-consuming process of selecting new independent agents;
|
| • |
the insistence of our insurance subsidiaries and Donegal Mutual that independent agents adhere to certain standards;
|
| • |
the ability of our insurance subsidiaries and Donegal Mutual to pay competitive and attractive commissions, bonuses and other incentives to independent agents; and
|
| • |
the ongoing consolidation of independent agencies, which may result in the acquisition of independent agencies from which our insurance subsidiaries and Donegal Mutual currently receive business by larger entities with which our
insurance subsidiaries and Donegal Mutual do not have business relationships.
|
While our insurance subsidiaries and Donegal Mutual sell insurance to policyholders solely through their network of independent agencies, many competitors of our insurance subsidiaries and Donegal Mutual sell insurance
through a variety of delivery methods, including independent agencies, captive agencies and direct sales. To the extent that current and potential policyholders change their distribution channel preference, the business, financial condition and
results of operations of our insurance subsidiaries may be adversely affected.
Competition within the property and casualty insurance industry may adversely impact the revenues and profit margins of our insurance subsidiaries.
The property and casualty insurance industry is intensely competitive, and the pricing of insurance products is subject to significant fluctuations and uncertainties. Competition can be based on many factors,
including:
|
•
|
the perceived financial strength of the insurer;
|
|
•
|
premium rates;
|
|
•
|
policy terms and conditions;
|
|
•
|
policyholder service;
|
|
•
|
reputation; and
|
|
•
|
experience.
|
Our insurance subsidiaries and Donegal Mutual compete with many regional and national property and casualty insurance companies, including direct sellers of insurance products, insurers having their own agency
organizations and other insurers represented by independent agents. Many of these insurers have greater capital than our insurance subsidiaries and Donegal Mutual, have substantially greater financial, technical and operating resources, have
substantially greater exposure and access to potential customers and have equal or higher ratings from A.M. Best than our insurance subsidiaries and Donegal Mutual. In addition, our competitors may become increasingly better capitalized in the
future as the property and casualty insurance industry continues to consolidate.
The greater capitalization of many of the competitors of our insurance subsidiaries and Donegal Mutual enables them to operate with lower profit margins and, therefore, allows them to market their products more
aggressively, to take advantage more quickly of new marketing opportunities and to offer lower premium rates. In addition to established insurers, our insurance subsidiaries and Donegal Mutual compete with a growing number of start-ups, some of
which have received substantial infusions of capital, that seek to disrupt traditional business platforms and distribution channels. Our insurance subsidiaries and Donegal Mutual may not be able to maintain their current competitive position in
the markets in which they operate if their competitors offer prices for their products that are lower than the prices our insurance subsidiaries and Donegal Mutual are prepared to offer. Moreover, if these competitors lower the price of their
products and our insurance subsidiaries and Donegal Mutual meet their pricing, the profit margins and revenues of our insurance subsidiaries and Donegal Mutual may decrease and their ratios of claims and expenses to premiums may increase. All of
these factors could materially adversely affect the financial condition and results of operations of our insurance subsidiaries and their A.M. Best ratings.
If A.M. Best downgrades the rating it has assigned to Donegal Mutual or any of our insurance subsidiaries, it would adversely affect their competitive position.
Industry ratings are a factor in establishing and maintaining the competitive position of insurance companies. A.M. Best, an industry-accepted source of insurance company financial strength ratings, rates Donegal
Mutual and our insurance subsidiaries. A.M. Best ratings provide an independent opinion of an insurance company’s financial health and its ability to meet its obligations to its policyholders. We believe that the financial strength rating of A.M.
Best is material to the operations of Donegal Mutual and our insurance subsidiaries. For example, certain lenders require customers to purchase insurance from an insurance carrier that has received an A.M. Best rating that exceeds a certain
level. Currently, Donegal Mutual and our insurance subsidiaries each have an A (Excellent) rating from A.M. Best. In May 2025, A.M. Best affirmed its A (Excellent) ratings of Donegal Mutual and our insurance subsidiaries. However, if A.M. Best
were to downgrade the rating of Donegal Mutual or any of our insurance subsidiaries, it would adversely affect the competitive position of Donegal Mutual or that insurance subsidiary and make it more difficult for it to market its products and
retain its existing policyholders.
Economic disruption related to a future pandemic may adversely affect our revenues, profitability, results of operations, cash flows, liquidity and financial
condition.
We cannot predict the ultimate impact that the economic and financial disruption related to a pandemic may have on us. Risks related to a pandemic include, but are not limited to, the following:
| • |
the business operations or a specific operational function of our insurance subsidiaries and Donegal Mutual could be disrupted by the illness of significant numbers of their employees and remedial efforts that would be required upon
discovery of exposure to a communicable illness within their facilities;
|
| • |
the business operations of our insurance subsidiaries and Donegal Mutual are dependent upon technology systems for which regular physical access is required to maintain critical operational capabilities, and the business operations of
our insurance subsidiaries and Donegal Mutual would be adversely impacted by government mandates requiring closure of facilities where those technology systems are located or restricting physical access to such facilities;
|
| • |
the revenues of our insurance subsidiaries and Donegal Mutual may decrease as a result of reduced demand for their insurance products as economic disruption adversely impacts current and potential insurance customers;
|
| • |
our insurance subsidiaries and Donegal Mutual may incur an increase in their losses and loss expenses in certain lines of business as a result of a pandemic and related economic disruption, and such losses and loss expenses may exceed
the reserves our insurance subsidiaries and Donegal Mutual have established or may establish in the future;
|
| • |
our insurance subsidiaries and Donegal Mutual may incur increased costs related to legal disputes over policy coverages or exclusions and their defense against litigation related to a pandemic;
|
| • |
legislative, judicial and regulatory actions may expand coverage definitions, retroactively mandate coverage or otherwise require our insurance subsidiaries and Donegal Mutual to pay losses for damages that their policies explicitly
excluded or did not intend to cover;
|
| • |
legislative, judicial and regulatory actions may require our insurance subsidiaries and Donegal Mutual to reduce or refund premiums, suspend cancellation of policies for non-payment of premiums or otherwise grant extended grace periods
and time allowances for the payment of premium balances due to them;
|
| • |
our insurance subsidiaries and Donegal Mutual may not be able to collect premium balances due to them, resulting in reduced operating cash flows and an increase in premium write-offs that would increase their operating expenses;
|
| • |
our insurance subsidiaries may suffer declines in the market values of their investments as a result of financial market volatility related to pandemic concerns and related economic disruption; and
|
| • |
economic disruption related to a pandemic could result in significant declines in the credit quality of issuers, ratings downgrades or changes in financial market conditions and regulatory changes that might adversely impact the value of
the fixed-maturity investments that our insurance subsidiaries own.
|
Dividends from our insurance subsidiaries are a significant source of funds for the payment of our operating expenses and dividends to our stockholders; however, there are
regulatory restrictions and business considerations that may limit the amount of dividends our insurance subsidiaries may pay to us.
As a holding company, we rely on dividends from our insurance subsidiaries as a significant source of funds to meet our corporate obligations and to pay dividends to our stockholders. The amount of dividends our
insurance subsidiaries can pay to us is subject to regulatory restrictions and depends on the amount of surplus our insurance subsidiaries maintain. From time to time, the NAIC and various state insurance regulators consider modifying the method of
determining the amount of dividends that an insurance company may pay without prior regulatory approval. The maximum amount of ordinary dividends that our insurance subsidiaries can pay to us in 2026 without prior regulatory approval is
approximately $66.4 million. Other business and regulatory considerations, such as the impact of dividends on surplus that could affect the ratings of our insurance subsidiaries, competitive conditions, RBC requirements, the investment results of
our insurance subsidiaries and the amount of premiums that our insurance subsidiaries write could also adversely impact the ability of our insurance subsidiaries to pay dividends to us.
The growth and profitability of our insurance subsidiaries depend, in part, on the effective maintenance and ongoing development of Donegal Mutual’s information technology
systems, and the allocation of related costs to our insurance subsidiaries may adversely impact their profitability.
Our insurance subsidiaries utilize Donegal Mutual’s information technology systems to conduct their insurance business, including policy quoting and issuance, claims processing, processing of incoming premium payments
and other important functions. As a result, the ability of our insurance subsidiaries to grow their business and conduct profitable operations depends on Donegal Mutual’s ability to maintain its existing information technology systems and to
develop new technology systems that will support the business of Donegal Mutual and our insurance subsidiaries in a cost-efficient manner and provide information technology capabilities equivalent to those of our competitors. The allocation among
our insurance subsidiaries and Donegal Mutual of the costs of developing and maintaining Donegal Mutual’s information technology systems may adversely impact our insurance subsidiaries’ expense ratio and underwriting profitability, and such costs
may exceed Donegal Mutual’s and our expectations.
Donegal Mutual is currently in the midst of a multi-year effort to modernize certain of its key infrastructure and applications systems, and the allocation of related costs to our insurance subsidiaries has resulted in
an increase to their expense ratio. These new systems are intended to provide various benefits to the member companies of the Donegal Insurance Group, including streamlined workflows and business processes, service enhancements for their agents and
policyholders, opportunities to implement new product models and innovative business solutions, greater utilization of data analytics and operational efficiencies. From 2020 to 2024, we implemented five major releases of new systems. In 2025,
Donegal Mutual implemented the final two major releases of new systems for the remaining lines of business the Donegal Insurance Group issues currently and for the conversion of remaining legacy renewal policies of the Donegal Insurance Group. The
conversion process will continue into 2027 as legacy policies renew on a state-by-state rollout schedule. During 2025, Donegal Mutual also began planning for the migration of its claims, billing and policy administration application systems from
on-premise versions to cloud-based versions of these applications that we expect will occur in a phased approach over the next two years. Even with Donegal Mutual’s and our best planning and efforts and the involvement of third-party experts,
Donegal Mutual may not complete the implementation of these new systems within its planned timeframes or budget. Further, Donegal Mutual’s information technology systems may not deliver the benefits Donegal Mutual and we expect and may fail to keep
pace with our competitors’ information technology systems. As a result, Donegal Mutual and our insurance subsidiaries may not have the ability to grow their business and meet their profitability objectives.
While we are currently placing less emphasis on pursuing acquisitions because Donegal Mutual and we believe there are opportunities for profitable organic growth, our strategy to
grow in part through acquisitions of other insurance companies exposes us to risks that could adversely affect our results of operations and financial condition.
The affiliation with, and acquisition of, other insurance companies involves risks that could adversely affect our results of operations and financial condition. The risks associated with these affiliations and
acquisitions include:
| • |
the potential inadequacy of reserves for losses and loss expenses of the other insurer;
|
| • |
the need to supplement management of the other insurer with additional experienced personnel;
|
| • |
conditions imposed by regulatory agencies that make the realization of cost-savings through integration of the operations of the other insurer with our operations more difficult;
|
| • |
our management’s lack of familiarity with the geography, demographics and distribution systems in the markets the other insurer serves that cause the other insurer to fail to meet the growth and profitability objectives we anticipated at
the time of the acquisition or affiliation;
|
| • |
potential difficulties with integration of information technology systems and other operations;
|
| • |
the need of the other insurer for additional capital that we did not anticipate at the time of the acquisition or affiliation; and
|
| • |
the use of more of our management’s time in improving the operations of the other insurer than we originally anticipated.
|
If we cannot obtain sufficient capital to fund the organic growth of our insurance subsidiaries and to make acquisitions, we may not be able to expand our business.
Our strategy is to expand our business through the organic growth of our insurance subsidiaries and through our strategic acquisitions of regional insurance companies. Our insurance subsidiaries may require additional
capital in the future to support this strategy. If we cannot obtain sufficient capital on satisfactory terms and conditions, we may not be able to expand the business of our insurance subsidiaries or to make future acquisitions. Our ability to
obtain additional financing will depend on a number of factors, many of which are beyond our control. For example, we may not be able to obtain additional debt or equity financing because we or our insurance subsidiaries may already have
substantial debt at the time, because we or our insurance subsidiaries do not have sufficient cash flow to service or repay our existing or additional debt or because financial institutions are not making financing available. In addition, any
equity capital we obtain in the future could be dilutive to our existing stockholders.
The investment portfolios of our insurance subsidiaries consist primarily of fixed-income securities; therefore, the investment income and the fair value of the investment
portfolios of our insurance subsidiaries could decrease as a result of a number of factors.
Our insurance subsidiaries invest the premiums they receive from their policyholders and maintain investment portfolios that consist primarily of fixed-income securities. The effective management of these investment
portfolios is an important component of the profitability of our insurance subsidiaries. Our insurance subsidiaries derive a significant portion of their operating income from the income they receive on their invested assets. A number of factors
may affect the quality and/or yield of their investment portfolios, including the general economic and business environment, government monetary policy, changes in the credit quality of the issuers of the fixed-income securities our insurance
subsidiaries own, changes in market conditions and regulatory changes. The fixed-income securities our insurance subsidiaries own consist primarily of securities issued by domestic entities that are backed by either the credit or collateral of the
underlying issuer. Factors such as an economic downturn, disruption in the credit market or the availability of credit, a regulatory change pertaining to a particular issuer’s industry, a significant deterioration in the cash flows of the issuer or
a change in the issuer’s marketplace may adversely affect the ability of our insurance subsidiaries to collect principal and interest from the issuer in which they invest.
The investments of our insurance subsidiaries are also subject to risk resulting from interest rate fluctuations. As we experienced when market interest rates increased significantly in 2022, increasing interest rates
or a widening in the spread between interest rates available on U.S. Treasury securities and corporate debt or asset-backed securities will typically have an adverse impact on the market values of fixed-rate securities. If interest rates decline,
our insurance subsidiaries will generally have a lower overall rate of return on investments of cash their operations generate. In addition, in the event of the call or maturity of investments in a low interest rate environment, our insurance
subsidiaries may not be able to reinvest the proceeds in securities with comparable interest rates. Changes in interest rates may reduce both the profitability and the return on the invested capital of our insurance subsidiaries.
We and our insurance subsidiaries depend on key personnel. The loss of any member of our executive management or the senior management of our insurance subsidiaries could
negatively affect the continuation of our business strategies and achievement of our growth objectives.
The loss of, or failure to attract, key personnel could significantly impede our financial plans, growth, marketing and other objectives and those of our insurance subsidiaries. The continued success of our insurance
subsidiaries depends to a substantial extent on the ability and experience of their senior management. Our insurance subsidiaries and we believe that our future success is dependent on our ability to attract and retain additional skilled and
qualified personnel and to expand, train and manage our employees. We and Donegal Mutual have employment agreements with our senior officers, including all of our named executive officers.
The reinsurance agreements on which our insurance subsidiaries rely do not relieve our insurance subsidiaries from their primary liability to their policyholders, and our
insurance subsidiaries face a risk of non-payment from their reinsurers as well as the non-availability of reinsurance in the future.
Our insurance subsidiaries rely on reinsurance agreements to limit their maximum net loss from large single catastrophic risks or excess of loss risks in areas where our insurance subsidiaries may have a concentration
of policyholders. Reinsurance also enables our insurance subsidiaries to increase their capacity to write insurance because it has the effect of leveraging the surplus of our insurance subsidiaries. Although the reinsurance our insurance
subsidiaries maintain provides that the reinsurer is liable to them for any reinsured losses, the reinsurance agreements do not generally relieve our insurance subsidiaries from their primary liability to their policyholders if the reinsurer fails
to pay the reinsurance claims of our insurance subsidiaries. To the extent that a reinsurer is unable to pay losses for which it is liable to our insurance subsidiaries, our insurance subsidiaries remain liable for such losses. At December 31,
2025, our insurance subsidiaries had approximately $90.7 million of reinsurance receivables from third-party reinsurers relating to paid and unpaid losses. Any insolvency or inability of these reinsurers to make timely payments to our insurance
subsidiaries under the terms of their reinsurance agreements would adversely affect the results of operations of our insurance subsidiaries.
Michigan law requires several of our insurance subsidiaries to provide certain medical benefits under the personal injury protection, or PIP, coverage of the personal automobile and commercial automobile policies
they write in the state of Michigan. Michigan law also requires those insurance subsidiaries to be members of the Michigan Catastrophic Claims Association, or MCCA, in order to write automobile insurance. MCCA receives funding through assessments
that its members collect from policyholders in the state and provides reinsurance for PIP claims that exceed a set retention. At December 31, 2025, our insurance subsidiaries had approximately $45.5 million of reinsurance receivables from MCCA
relating to paid and unpaid losses. The MCCA has generated significant operating deficits in recent years, and applicable Michigan law allows MCCA to assess its member companies for all losses and deficits through adjustments to future
assessments. Although we currently consider the risk to be remote, should MCCA be unable to fulfill its payment obligations to our insurance subsidiaries in the future, the financial condition and results of operations of our insurance
subsidiaries could be adversely affected.
In addition, our insurance subsidiaries face a risk of the non-availability of reinsurance or an increase in reinsurance costs that could adversely affect their ability to write business or their results of operations.
Market conditions beyond the control of our insurance subsidiaries, such as the amount of surplus in the reinsurance market and the frequency and severity of natural and man-made catastrophes, affect both the availability and the cost of the
reinsurance our insurance subsidiaries purchase. If our insurance subsidiaries cannot maintain their current level of reinsurance or purchase new reinsurance protection in amounts that our insurance subsidiaries consider sufficient, our insurance
subsidiaries would either have to accept an increase in their net risk retention or reduce their insurance writings, either of which could adversely affect them. For example, due to increased reinsurance pricing and reduced reinsurance market
capacity, our insurance subsidiaries increased their net retentions under several of their reinsurance programs for 2024 and 2025.
The disruption or failure of Donegal Mutual’s information technology systems or the compromise of the security of those systems that results in the theft or
misuse of confidential information could materially impact adversely the business of Donegal Mutual and our insurance subsidiaries.
Our insurance subsidiaries’ business operations depend significantly upon the availability and successful operation of Donegal Mutual’s information technology systems. In addition, in the normal course of their
operations, Donegal Mutual and our insurance subsidiaries collect, utilize and maintain confidential information regarding individuals and businesses. While Donegal Mutual has established various security measures to protect its information
technology systems and confidential data, unanticipated computer viruses, malware, ransomware, power outages, unauthorized access or other cyberattacks could disrupt those systems or result in the misappropriation or loss of confidential data.
Donegal Mutual could experience technology system failures or other outages that would impact the availability of its information technology systems. Donegal Mutual has experienced brief disruptions of systems in the past, including those systems
that allow underwriting and processing of new policies. Disruption in the availability of Donegal Mutual’s information technology systems could affect the ability of Donegal Mutual and our insurance subsidiaries to underwrite and process their
policies timely, process and settle claims promptly and provide expected levels of customer service to agents and policyholders.
While Donegal Mutual has identified threats to the security of its information technology systems, Donegal Mutual and we are unaware of any significant breach of the security measures Donegal Mutual maintains. A
significant breach of the security of Donegal Mutual’s information technology systems that results in the misappropriation or misuse of confidential information could damage the business reputation of Donegal Mutual and our insurance subsidiaries
and could expose Donegal Mutual and our insurance subsidiaries to litigation. The financial impact to Donegal Mutual, us and our insurance subsidiaries of a significant breach could be material.
Risks Relating to Us and Our Common Stock
The price of our common stock may be adversely affected by its low trading volume.
Our Class A common stock and our Class B common stock have limited liquidity. Reported average daily trading volume for our Class A common stock and our Class B common stock for the year ended December 31, 2025 was
approximately 128,268 shares and approximately 1,288 shares, respectively. This limited liquidity could subject our shares of Class A common stock and our shares of
Class B common stock to greater price volatility.
Donegal Mutual is our controlling stockholder. Donegal Mutual and its directors and executive officers have potential conflicts of interest between the best interests of our
stockholders and the best interests of the policyholders of Donegal Mutual.
Donegal Mutual controls the election of all of the members of our board of directors. Six of the ten members of our board of directors are also directors of Donegal Mutual. Donegal Mutual and we share the same
executive officers. These common directors and executive officers have a fiduciary duty to our stockholders and also have a fiduciary duty to the policyholders of Donegal Mutual. Among the potential conflicts of interest that could arise from these
separate fiduciary duties are the following:
| • |
we and Donegal Mutual periodically review the percentage participation of Atlantic States and Donegal Mutual in the underwriting pool that Donegal Mutual and Atlantic States have maintained since 1986;
|
| • |
our insurance subsidiaries and Donegal Mutual annually review and then establish the terms of certain reinsurance agreements between our insurance subsidiaries and Donegal Mutual;
|
| • |
we and Donegal Mutual allocate certain shared expenses among ourselves and our insurance subsidiaries in accordance with various inter-company expense-sharing agreements; and
|
| • |
we and our insurance subsidiaries may enter into other transactions or contractual relationships with Donegal Mutual.
|
Donegal Mutual has sufficient voting power to determine the outcome of substantially all matters submitted to our stockholders for approval.
Each share of our Class A common stock has one-tenth of a vote per share and generally votes as a single class with our Class B common stock. Each share of our Class B common stock has one vote per share and generally
votes as a single class with our Class A common stock. Donegal Mutual has the right to vote approximately 70% of the combined voting power of our Class A common stock and our Class B common stock and has
sufficient voting control to and has acted to:
| • |
elect all of the members of our board of directors, who determine our management and policies; and
|
| • |
control the outcome of any corporate transaction or other matter submitted to a vote of our stockholders for approval, including mergers or other acquisition proposals and the sale of all or substantially all of our assets, in each case
regardless of how all of our stockholders other than Donegal Mutual vote their shares.
|
The interests of Donegal Mutual in maintaining this greater-than-majority voting control of us may have an adverse effect on the price of our Class A common stock and the price of our Class B common stock because of
the absence of any potential “takeover” premium and may, therefore, be inconsistent with the interests of our stockholders other than Donegal Mutual.
Donegal Mutual’s majority voting control of us, certain provisions of our certificate of incorporation and by-laws and certain provisions of Delaware law make it
remote that anyone could acquire actual control of us unless Donegal Mutual were in favor of another person’s acquisition of control of us.
Donegal Mutual’s majority voting control of us, certain anti-takeover provisions in our certificate of incorporation and by-laws and certain provisions of the Delaware General Corporation Law, or the DGCL, could delay
or prevent the removal of members of our board of directors and could make a merger, tender offer or proxy contest involving us more expensive as well as unlikely to succeed, even if such events were in the best interests of our stockholders other
than Donegal Mutual. These factors could also discourage a third party from attempting to acquire control of us. In particular, our certificate of incorporation and by-laws include the following anti-takeover provisions:
| • |
our board of directors is classified into three classes, so that our stockholders elect only one-third of the members of our board of directors each year;
|
| • |
our stockholders may remove our directors only for cause;
|
| • |
our stockholders may not take stockholder action except at an annual or special meeting of our stockholders;
|
| • |
the request of stockholders holding at least 20% of the combined voting power of our Class A common stock and our Class B common stock is required for a stockholder to call a special meeting of our stockholders;
|
| • |
our by-laws require that stockholders provide advance notice to us to nominate candidates for election to our board of directors or to propose any other item of stockholder business at a stockholders’ meeting;
|
| • |
we do not permit cumulative voting rights in the election of our directors;
|
| • |
our certificate of incorporation does not provide for preemptive rights in connection with any issuance of securities by us; and
|
| • |
our board of directors may issue, without stockholder approval unless otherwise required by law, preferred stock with such terms as our board of directors may determine.
|
We have authorized preferred stock that we could issue without stockholder approval to make it more difficult for a third party to acquire us.
We have 2.0 million authorized shares of preferred stock that we could issue in one or more series without further stockholder approval, unless the DGCL or the rules of the NASDAQ Global Select Market otherwise
require, and upon such terms and conditions, and having such rights, privileges and preferences, as our board of directors may determine. Our potential issuance of preferred stock may make it more difficult for a third party to acquire control of
us.
Because we are an insurance holding company, no person can acquire or seek to acquire a 10% or greater interest in us without first obtaining approval of the insurance
commissioners of the states of domicile of each of our insurance subsidiaries.
We own insurance subsidiaries domiciled in the states of Michigan, Pennsylvania and Virginia, and Donegal Mutual is domiciled in Pennsylvania and owns or controls insurance companies domiciled in Georgia and New
Mexico. The insurance laws of each of these states provide that no person can acquire or seek to acquire a 10% or greater interest in us without first filing specified information with the insurance commissioners of those states and obtaining the
prior approval of the proposed acquisition of a 10% or greater interest in us by each of the state insurance commissioners based on statutory standards designed to protect the safety and soundness of us and our insurance subsidiaries. These
approval requirements may make it more difficult for a third party to acquire control of us.
We have no unresolved written comments from the Securities and Exchange Commission staff regarding our filings under the Exchange Act.
Our insurance subsidiaries utilize the information systems Donegal Mutual maintains. Donegal Mutual has a robust information security program in place as a component of the enterprise-level risk management program of Donegal Mutual and us. The integration of Donegal Mutual’s information security program into the enterprise-level risk management program is intended to promote the inclusion of cybersecurity considerations in decision-making processes throughout Donegal Mutual.
Donegal Mutual also requires annual cybersecurity awareness training for all employees who serve Donegal Mutual and our insurance subsidiaries. Donegal Mutual expects all employees to assist in safeguarding its
information systems and to assist in the discovery and reporting of cybersecurity incidents. This enterprise-wide program is intended to identify and assess internal and external cyber and information security risks that may threaten the security
or integrity of the information stored on Donegal Mutual’s information systems or those of third-party providers from unauthorized access, use or other malicious acts.
In addition to monitoring cybersecurity threats to Donegal Mutual’s information systems and information technology infrastructure, Donegal Mutual and we also assess and monitor the information security posture of third-party service providers whose services we deem critical to our operations. This process is designed to help Donegal Mutual’s information security personnel identify and mitigate risks related to data breaches or other cybersecurity incidents originating from third-party service providers in order to better protect Donegal Mutual’s information systems and information technology infrastructure.
We and our insurance subsidiaries share administrative headquarters with Donegal Mutual in a building in Marietta, Pennsylvania that Donegal Mutual owns. The Marietta headquarters has approximately 270,000 square feet
of office space. Southern owns a facility of approximately 10,000 square feet in Glen Allen, Virginia. In addition, Donegal Mutual leases office space in Albuquerque, New Mexico, MICO leases office space in Grand Rapids, Michigan, and Southern
Mutual owns a building in Athens, Georgia. Donegal Mutual and our insurance subsidiaries share property-related expenses proportionately under a services allocation agreement.
Our insurance subsidiaries are parties to routine litigation that arises in the ordinary course of their insurance business. We believe that the resolution of these lawsuits will not have a material adverse effect on
the financial condition or results of operations of our insurance subsidiaries. However, regardless of outcome, litigation and related matters could have an adverse impact on us and our insurance subsidiaries due to defense and settlement costs,
diversion of management resources, negative publicity, reputational harm and other factors.
Not applicable.
|
Item 5.
|
Market for Registrant’s Common Equity, Related Stockholder Matters and Issuer Purchases of Equity Securities.
|
Our Class A common stock and Class B common stock trade on the NASDAQ Global Select Market under the symbols “DGICA” and “DGICB,” respectively.
At the close of business on March 2, 2026, we had approximately 1,403 holders
of record of our Class A common stock and approximately 196 holders of record of our Class B common stock.
We declared dividends of $0.73 per share on our Class A common stock and $0.66 per share on our Class B common stock in 2025, compared to $0.69 per share on our Class A common stock and $0.62 per share on our Class B
common stock in 2024.
Unregistered Sales of Equity Securities and Use of Proceeds.
Between October 1, 2025 and December 31, 2025, Donegal Mutual purchased shares of our Class A common stock as set forth in the table below:
|
Period
|
(a) Total Number of Shares (or Units) Purchased
|
(b) Average Price Paid per Share (or Unit)
|
(c) Total Number of Shares
(or Units) Purchased as
Part of Publicly
Announced Plans or
Programs
|
(d) Maximum Number (or
Approximate Dollar Value)
of Shares (or Units) that
May Yet Be Purchased
Under the Plans or
Programs
|
||||
|
Month #1
October 1-31, 2025
|
Class A – None
Class B – None
|
Class A – None
Class B – None
|
Class A – None
Class B – None
|
|||||
|
Month #2
November 1-30, 2025
|
Class A – 150,782
Class B – 43,404
|
Class A – $19.60
Class B – $17.50
|
Class A – 150,782
Class B – 43,404
|
(1)
|
||||
|
Month #3
December 1-31, 2025
|
Class A – 123,343
Class B – None
|
Class A – $19.90
Class B – None
|
Class A – 123,343
Class B – None
|
(1)
|
||||
|
Total
|
Class A – 274,125
Class B – 43,404
|
Class A – $19.73
Class B – $17.50
|
Class A – 274,125
Class B – 43,404
|
| (1) |
Donegal Mutual purchased these shares pursuant to its disclosure on April 29, 2022 that it will, at its discretion, purchase shares of our Class A common stock and Class B common stock at market prices prevailing from time to
time in the open market subject to the provisions of SEC Rule 10b-18 and in privately negotiated transactions. Such disclosure did not stipulate a maximum number of shares that may be purchased under this program.
|
The following graph provides an indicator of cumulative total stockholder returns on our Class A common stock and our Class B common stock for the period beginning on December 31, 2020 and ending on December 31, 2025,
compared to the Russell 2000 Index and a peer group comprised of six property and casualty insurance companies over the same period. The peer group consists of Cincinnati Financial Corp., Hanover Insurance Group Inc., Horace Mann Educators Corp.,
Kemper Corp., Selective Insurance Group Inc. and United Fire Group Inc. The graph shows the change in value of an initial $100 investment on December 31, 2020, assuming reinvestment of all dividends.
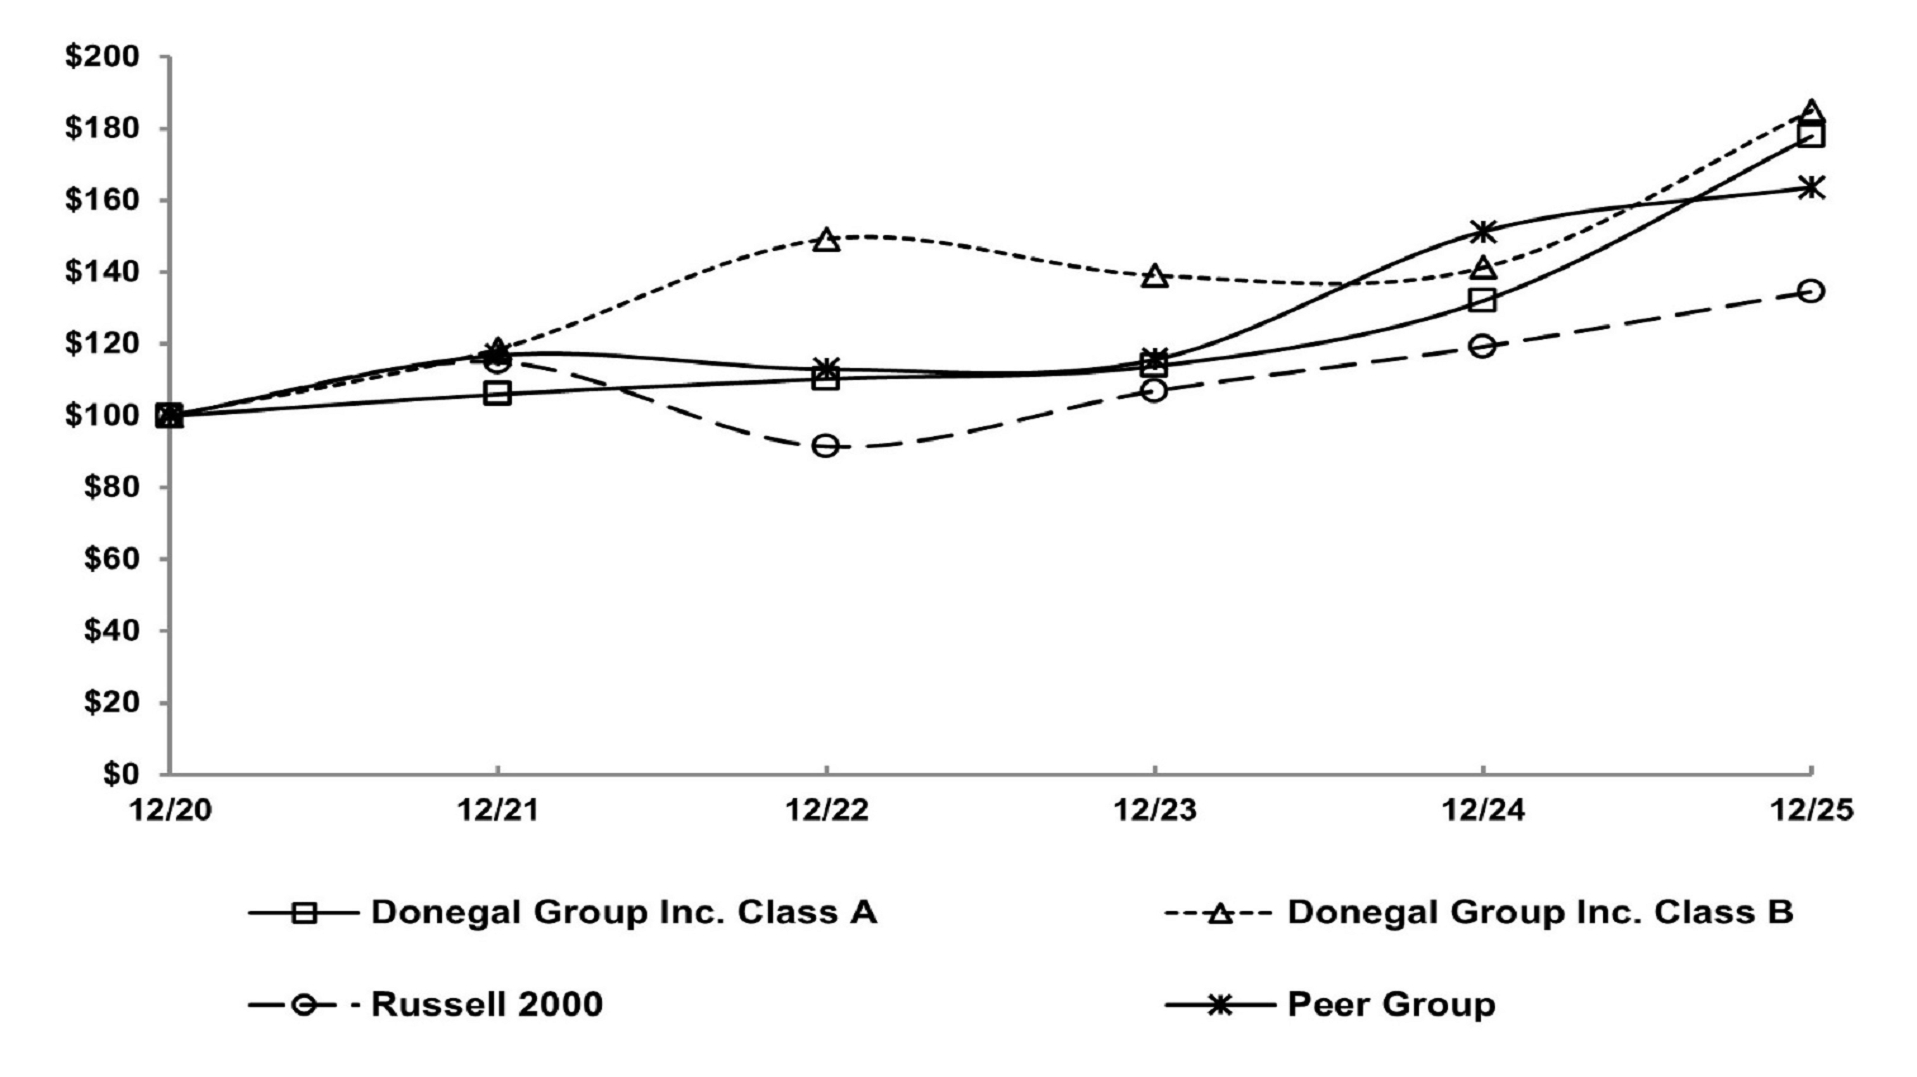
|
2020
|
2021
|
2022
|
2023
|
2024
|
2025
|
|||||||||||||||||||
|
Donegal Group Inc. Class A
|
$
|
100.00
|
$
|
105.99
|
$
|
110.28
|
$
|
113.81
|
$
|
131.99
|
$
|
177.72
|
||||||||||||
|
Donegal Group Inc. Class B
|
100.00
|
118.61
|
149.27
|
139.09
|
141.29
|
184.97
|
||||||||||||||||||
|
Russell 2000
|
100.00
|
114.82
|
91.35
|
106.82
|
119.14
|
134.40
|
||||||||||||||||||
|
Peer Group
|
100.00
|
116.90
|
113.00
|
115.68
|
151.35
|
163.65
|
||||||||||||||||||
Research Data Group prepared the foregoing performance graph and data. The performance graph and accompanying data shall not be deemed “filed” as part of this Form 10-K Report for purposes of Section 18 of the Exchange
Act or otherwise subject to the liabilities of that section and should not be deemed incorporated by reference into any other filing we make under the Securities Act of 1933 or the Securities Exchange Act of 1934, except to the extent we
specifically incorporate the performance graph and accompanying data by reference into such filing.
Donegal Mutual Insurance Company (“Donegal Mutual”) organized us as an insurance holding company on August 26, 1986. See “Business - History and Organizational Structure” for more information. Our insurance
subsidiaries are Atlantic States Insurance Company (“Atlantic States”), Michigan Insurance Company (“MICO”), The Peninsula Insurance Company and its wholly owned subsidiary, Peninsula Indemnity Company (collectively, “Peninsula”), and Southern
Insurance Company of Virginia (“Southern”). Our insurance subsidiaries and their affiliates write commercial and personal lines of property and casualty coverages exclusively through a network of independent insurance agents in certain
Mid-Atlantic, Midwest, Southern and Southwestern states. The commercial lines products of our insurance subsidiaries consist primarily of commercial automobile, commercial multi-peril and workers’ compensation policies. The personal lines products
of our insurance subsidiaries consist primarily of homeowners and private passenger automobile policies.
At December 31, 2025, Donegal Mutual held approximately 44% of our outstanding Class A common stock and approximately 85% of our outstanding Class B common stock. This ownership provides Donegal Mutual with
approximately 70% of the combined voting power of our outstanding shares of Class A common stock and our outstanding shares of Class B common stock.
Donegal Mutual and Atlantic States have participated in a proportional reinsurance agreement, or pooling agreement, since 1986. Under the pooling agreement, Donegal Mutual and Atlantic States contribute substantially
all of their respective premiums, losses and loss expenses to the underwriting pool, and the underwriting pool, acting through Donegal Mutual, then allocates 80% of the pooled business to Atlantic States. Thus, Donegal Mutual and Atlantic States
share the underwriting results of the pooled business in proportion to their respective participation in the underwriting pool. The operations of our insurance subsidiaries and Donegal Mutual are interrelated due to the pooling agreement and other
factors. While maintaining the separate corporate existence of each company, our insurance subsidiaries conduct business together with Donegal Mutual and its insurance subsidiaries as the Donegal Insurance Group. The Donegal Insurance Group is not
a legal entity, is not an insurance company and does not issue or administer insurance policies. Rather, it is a trade name that refers to the group of insurance companies that are affiliated with Donegal Mutual. See “Business - Relationship with
Donegal Mutual” for more information regarding the pooling agreement and other transactions with our affiliates.
Donegal Mutual and our insurance subsidiaries operate together as the Donegal Insurance Group and share a combined business plan designed to achieve market penetration and underwriting profitability objectives. The
products our insurance subsidiaries and Donegal Mutual offer are generally complementary, thereby allowing Donegal Insurance Group to offer a broader range of products to a given market and to expand Donegal Insurance Group’s ability to service an
entire personal lines or commercial lines account. Distinctions within the products of Donegal Mutual and our insurance subsidiaries generally allow the individual companies to manage certain risk segments through variations in coverage, terms and
pricing. Therefore, the underwriting profitability of the business the individual companies write directly will vary. However, because the pool homogenizes the risk characteristics of the predominant percentage of the business Donegal Mutual and
Atlantic States write directly and each company shares the underwriting results according to each company’s participation percentage, each company realizes its percentage share of the underwriting results of the pool.
In July 2013, our board of directors authorized a share repurchase program pursuant to which we have the authority to purchase up to 500,000 additional shares of our Class A common stock at prices prevailing from time
to time in the open market subject to the provisions of the SEC Rule 10b-18 and in privately negotiated transactions. We did not purchase any shares of our Class A common stock under this program during 2025 or 2024. We have purchased a total of
57,658 shares of our Class A common stock under this program from its inception through December 31, 2025.
On April 29, 2022, Donegal Mutual disclosed that it will, at its discretion, purchase shares of our Class A common stock and our Class B common stock at market prices prevailing from time to time in the open market
subject to the provisions of SEC Rule 10b-18 and in privately negotiated transactions. Such disclosure did not stipulate a maximum number of shares that may be purchased under this program. Donegal Mutual purchased 776,332 and 1,057,282 shares of
our Class A common stock during 2025 and 2024, respectively. Donegal Mutual purchased 43,404 shares of our Class B common stock during 2025. Donegal Mutual did not purchase any shares of our Class B common stock during 2024.
In September 2025, Donegal Mutual and Southern entered into a renewal rights agreement with an affiliate of a farm-focused Pennsylvania-based mutual insurance group to provide a continuation option for their farm
policyholders when they begin to non-renew all farm policies as they expire beginning in the second quarter of 2026. Donegal Mutual and Southern determined that the costs required to modernize the legacy farm product and systems were higher than
the projected return on investment for this non-core line of business that represents approximately $6 million in premiums. None of our other insurance subsidiaries offered farm policies. We currently include farm policies within other commercial
lines in our line of business reporting.
We combine our financial statements with those of our insurance subsidiaries and present them on a consolidated basis in accordance with GAAP.
Our insurance subsidiaries make estimates and assumptions that can have a significant effect on amounts and disclosures we report in our financial statements. The most significant estimates relate to the reserves of
our insurance subsidiaries for property and casualty insurance unpaid losses and loss expenses. While we believe our estimates and the estimates of our insurance subsidiaries are appropriate, the ultimate amounts may differ from the estimates we
provided. We regularly review our methods for making these estimates, and we reflect any adjustment we consider necessary in our results of operations for the period in which we make an adjustment.
Liabilities for losses and loss expenses are estimates at a given point in time of the amounts an insurer expects to pay with respect to incurred policyholder claims based on facts and circumstances the insurer knows
at that point in time. For example, legislative, judicial and regulatory actions may expand coverage definitions, retroactively mandate coverage or otherwise require our insurance subsidiaries to pay losses for damages that their policies
explicitly excluded or did not intend to cover. At the time of establishing its estimates, an insurer recognizes that its ultimate liability for losses and loss expenses will exceed or be less than such estimates. Our insurance subsidiaries base
their estimates of liabilities for losses and loss expenses on assumptions as to future loss trends, expected claims severity, judicial theories of liability and other factors. However, during the loss adjustment period, our insurance subsidiaries
may learn additional facts regarding individual claims, and, consequently, it often becomes necessary for our insurance subsidiaries to refine and adjust their estimates for these liabilities. We reflect any adjustments to the liabilities for
losses and loss expenses of our insurance subsidiaries in our consolidated results of operations in the period in which our insurance subsidiaries make adjustments to their estimates.
Our insurance subsidiaries maintain liabilities for the payment of losses and loss expenses with respect to both reported and unreported claims. Our insurance subsidiaries establish these liabilities for the purpose of
covering the ultimate costs of settling all losses, including investigation and litigation costs. Our insurance subsidiaries base the amount of their liability for reported losses primarily upon a case-by-case evaluation of the type of risk
involved, knowledge of the circumstances surrounding each claim and the insurance policy provisions relating to the type of loss the policyholder incurred. Our insurance subsidiaries determine the amount of their liability for unreported claims and
loss expenses on the basis of historical information by line of insurance. Our insurance subsidiaries account for inflation in the reserving function through analysis of costs and trends and reviews of historical reserving results. Our insurance
subsidiaries monitor their liabilities closely and recompute them periodically using new information on reported claims and a variety of statistical techniques. Our insurance subsidiaries do not discount their liabilities for losses and loss
expenses.
Reserve estimates can change over time because of unexpected changes in assumptions related to our insurance subsidiaries’ external environment and, to a lesser extent, assumptions related to our insurance
subsidiaries’ internal operations. For example, our insurance subsidiaries have experienced an increase in claims severity and a lengthening of the claim settlement periods on bodily injury claims during the past several years. In addition, the
COVID-19 pandemic and related government mandates and restrictions resulted in various changes from historical claims reporting and settlement trends during 2020 and resulted in significant increases in loss costs in several following years due to
a number of factors, including supply chain disruption, higher new and used automobile values, increases in the cost of replacement automobile parts and rising labor rates. These trend changes caused significant disruption to historical loss
patterns and gave rise to greater uncertainty as to the pattern of future loss settlements. Uncertainties regarding future trends include social inflation, availability and cost of replacement automobile parts and building materials, availability
and cost of skilled labor, the rate of specialized plaintiff attorney involvement in claims, plaintiff attorney utilization of litigation financing and the cost of medical technologies and procedures. Assumptions related to our insurance
subsidiaries’ external environment include the absence of significant changes in tort law and the legal environment that increase liability exposure, consistency in judicial interpretations of insurance coverage and policy provisions and the rate
of loss cost inflation. Internal assumptions include consistency in the recording of premium and loss statistics, consistency in the recording of claims, payment and case reserving methodology, accurate measurement of the impact of rate changes and
changes in policy provisions, consistency in the quality and characteristics of business written within a given line of business and consistency in reinsurance coverage and collectability of reinsured losses, among other items. To the extent our
insurance subsidiaries determine that underlying factors impacting their assumptions have changed, our insurance subsidiaries make adjustments in their reserves that they consider appropriate for such changes. Accordingly, our insurance
subsidiaries’ ultimate liability for unpaid losses and loss expenses will likely differ from the amount recorded at December 31, 2025. For every 1% change in our insurance subsidiaries’ loss and loss expense reserves, net of reinsurance
recoverable, the effect on our pre-tax results of operations would be approximately $7.1 million.
The establishment of appropriate liabilities is an inherently uncertain process and we can provide no assurance that our insurance subsidiaries’ ultimate liability will not exceed our insurance subsidiaries’ loss and
loss expense reserves and have an adverse effect on our results of operations and financial condition. Furthermore, we cannot predict the timing, frequency and extent of adjustments to our insurance subsidiaries’ estimated future liabilities,
because the historical conditions and events that serve as a basis for our insurance subsidiaries’ estimates of ultimate claim costs may change. As is the case for substantially all property and casualty insurance companies, our insurance
subsidiaries have found it necessary in the past to increase their estimated future liabilities for losses and loss expenses in certain periods and, in other periods, their estimated future liabilities for losses and loss expenses have exceeded
their actual liabilities for losses and loss expenses. Changes in our insurance subsidiaries’ estimates of their liability for losses and loss expenses generally reflect actual payments and their evaluation of information received subsequent to the
prior reporting period.
Our insurance subsidiaries recognized a decrease in their liability for losses and loss expenses of prior years of $10.3 million, $15.0 million and $16.7 million in 2025, 2024 and 2023, respectively. Our insurance
subsidiaries made no significant changes in their reserving philosophy or claims management personnel, and they have made no significant offsetting changes in estimates that increased or decreased their loss and loss expense reserves in those
years. The 2025 development represented 1.5% of the December 31, 2024 net carried reserves and resulted primarily from lower-than-expected loss emergence in all lines of business except other commercial lines (which is primarily commercial umbrella
liability) for accident years prior to 2025. The majority of the 2025 development related to decreases in the liability for losses and loss expenses of prior years for Southern and Peninsula. The 2024 development represented 2.2% of the December
31, 2023 net carried reserves and resulted primarily from lower-than-expected loss emergence in the commercial multi-peril, personal automobile and homeowner lines of business, offset partially by higher-than-expected loss emergence in the workers’
compensation and commercial automobile lines of business, for accident years prior to 2024. The majority of the 2024 development related to decreases in the liability for losses and loss expenses of prior years for Atlantic States and MICO. The
2023 development represented 2.5% of the December 31, 2022 net carried reserves and resulted primarily from lower-than-expected loss emergence in the personal automobile and commercial automobile lines of business for accident years prior to 2023.
The majority of the 2023 development related to decreases in the liability for losses and loss expenses of prior years for Atlantic States and MICO.
Excluding the impact of severe weather events and the COVID-19 pandemic, our insurance subsidiaries have noted stable amounts in the number of claims incurred and the number of claims outstanding at period ends
relative to their premium base in recent years across most of their lines of business. However, the amount of the average claim outstanding has increased gradually over the past several years due to various factors such as increased property and
automobile repair and replacement costs, rising medical loss costs and increased litigation trends and lengthening of repair completion times for property and automobile claims. We have also experienced a general slowing of settlement rates in
litigated claims. Our insurance subsidiaries could have to make further adjustments to their estimates in the future. However, on the basis of our insurance subsidiaries’ internal procedures, which analyze, among other things, their prior
assumptions, their experience with similar cases and historical trends such as reserving patterns, loss payments, pending levels of unpaid claims and product mix, as well as court decisions, economic conditions and public attitudes, we believe that
our insurance subsidiaries have made adequate provision for their liability for losses and loss expenses.
Atlantic States’ participation in the underwriting pool with Donegal Mutual exposes Atlantic States to adverse loss development on the business that Donegal Mutual contributes to the underwriting pool. However, pooled
business represents the predominant percentage of the net underwriting activity of both companies, and Donegal Mutual and Atlantic States share proportionately any adverse risk development relating to the pooled business. The business in the
underwriting pool is homogeneous and each company has a pro-rata share of the entire underwriting pool. Since the predominant percentage of the business of Atlantic States and Donegal Mutual is pooled and the results shared by each company
according to its participation level under the terms of the pooling agreement, the intent of the underwriting pool is to produce a more uniform and stable underwriting result from year to year for each company than either would experience
individually and to spread the risk of loss between the companies.
Our insurance subsidiaries’ liability for losses and loss expenses by major line of business at December 31, 2025 and 2024 consisted of the following:
|
2025
|
2024
|
|||||||
|
|
(in thousands)
|
|||||||
|
Commercial lines:
|
||||||||
|
Automobile
|
$
|
175,277
|
$
|
180,757
|
||||
|
Workers’ compensation
|
130,429
|
129,406
|
||||||
|
Commercial multi-peril
|
215,476
|
208,676
|
||||||
|
Other
|
53,249
|
39,336
|
||||||
|
Total commercial lines
|
574,431
|
558,175
|
||||||
|
|
||||||||
|
Personal lines:
|
||||||||
|
Automobile
|
100,855
|
116,693
|
||||||
|
Homeowners
|
27,565
|
26,591
|
||||||
|
Other
|
2,345
|
2,905
|
||||||
|
Total personal lines
|
130,765
|
146,189
|
||||||
|
|
||||||||
|
Total commercial and personal lines
|
705,196
|
704,364
|
||||||
|
Plus reinsurance recoverable
|
394,854
|
416,621
|
||||||
|
Total liability for losses and loss expenses
|
$
|
1,100,050
|
$
|
1,120,985
|
||||
We have evaluated the effect on our insurance subsidiaries’ loss and loss expense reserves and our stockholders’ equity in the event of reasonably likely changes in the variables we consider in establishing loss and
loss expense reserves. We established the range of reasonably likely changes based on a review of changes in accident year development by line of business and applied it to our insurance subsidiaries’ loss reserves as a whole. The selected range
does not necessarily indicate what could be the potential best or worst case or the most-likely scenario. The following table sets forth the effect on our insurance subsidiaries’ loss and loss expense reserves and our stockholders’ equity in the
event of reasonably likely changes in the variables considered in establishing loss and loss expense reserves:
|
Change in Loss and Loss
Expense Reserves Net of
Reinsurance
|
Adjusted Loss and Loss
Expense Reserves Net of
Reinsurance at
December 31, 2025
|
Percentage Change in
Equity at
December 31, 2025(1)
|
Adjusted Loss and Loss
Expense Reserves Net of
Reinsurance at
December 31, 2024
|
Percentage Change in
Equity at
December 31, 2024(1)
|
|||||||||||
|
(dollars in thousands)
|
|||||||||||||||
|
-10.0
|
%
|
$
|
634,676
|
8.7
|
%
|
$
|
633,928
|
10.2
|
%
|
||||||
|
-7.5
|
652,306
|
6.5
|
651,537
|
7.6
|
|||||||||||
|
-5.0
|
669,936
|
4.3
|
669,146
|
5.1
|
|||||||||||
|
-2.5
|
687,566
|
2.2
|
686,755
|
2.5
|
|||||||||||
|
Base
|
705,196
|
—
|
704,364
|
—
|
|||||||||||
|
2.5
|
722,826
|
-2.2
|
721,973
|
-2.5
|
|||||||||||
|
5.0
|
740,456
|
-4.3
|
739,582
|
-5.1
|
|||||||||||
|
7.5
|
758,086
|
-6.5
|
757,191
|
-7.6
|
|||||||||||
|
10.0
|
775,716
|
-8.7
|
774,800
|
-10.2
|
|||||||||||
|
(1)
|
Net of income tax effect.
|
Our insurance subsidiaries base their reserves for unpaid losses and loss expenses on current trends in loss and loss expense development and reflect their best estimates for future amounts needed to pay losses and
loss expenses with respect to incurred events currently known to them plus incurred but not reported (“IBNR”) claims. Our insurance subsidiaries develop their reserve estimates based on an assessment of known facts and circumstances, review of
historical loss settlement patterns, estimates of trends in claims severity, frequency, legal and regulatory changes and other assumptions. Our insurance subsidiaries consistently apply actuarial loss reserving techniques and assumptions, which
rely on historical information as adjusted to reflect current conditions, including consideration of recent case reserve activity. Our insurance subsidiaries use the point estimate their actuaries select. For the year ended December 31, 2025, the
actuaries developed a range from a low of $666.6 million to a high of $746.1 million and selected a point estimate of $705.2 million. The actuaries’ range of estimates for commercial lines in 2025 was $543.0 million to $607.8 million, and the
actuaries selected a point estimate of $574.4 million. The actuaries’ range of estimates for personal lines in 2025 was $123.5 million to $138.3 million, and the actuaries selected a point estimate of $130.8 million. For the year ended December 31,
2024, the actuaries developed a range from a low of $672.1 million to a high of $740.4 million and selected a point estimate of $704.4 million. The actuaries’ range of estimates for commercial lines in 2024 was $533.0 million to $587.5 million, and
the actuaries selected a point estimate of $558.2 million. The actuaries’ range of estimates for personal lines in 2024 was $139.1 million to $153.0 million, and the actuaries selected a point estimate of $146.2 million.
Our insurance subsidiaries seek to enhance their underwriting results by carefully selecting the product lines they underwrite. For personal lines products, our insurance subsidiaries insure standard and preferred
risks in private passenger automobile and homeowners lines. For commercial lines products, the commercial risks that our insurance subsidiaries primarily insure are business offices, wholesalers, service providers, contractors, artisans and light
manufacturing operations. Our insurance subsidiaries have limited exposure to asbestos and other environmental liabilities. Through the consistent application of this disciplined underwriting philosophy, our insurance subsidiaries have avoided many
of the “long-tail” issues other insurance companies have faced. We consider workers’ compensation to be a “long-tail” line of business, in that workers’ compensation claims tend to be settled over a longer time frame than those in the other lines
of business of our insurance subsidiaries.
The following table presents 2025 and 2024 claim count and payment amount information for workers’ compensation. Workers’ compensation losses primarily consist of indemnity and medical costs for injured workers.
|
For the Year Ended December 31,
|
||||||||
|
(dollars in thousands)
|
2025
|
2024
|
||||||
|
Number of claims pending, beginning of period
|
2,832
|
3,144
|
||||||
|
Number of claims reported
|
4,408
|
5,066
|
||||||
|
Number of claims settled or dismissed
|
4,762
|
5,378
|
||||||
|
Number of claims pending, end of period
|
2,478
|
2,832
|
||||||
|
Losses paid
|
$
|
52,449
|
$
|
54,597
|
||||
|
Loss expenses paid
|
$
|
10,216
|
$
|
10,953
|
||||
We believe that our focused business strategy has positioned us well for 2026 and beyond. Because our insurance subsidiaries do not prepare GAAP financial statements, we evaluate the performance of our commercial lines
and personal lines segments utilizing statutory accounting practices (“SAP”), which include financial measures that reflect the growth trends and underwriting results of our insurance subsidiaries.
We use the following financial data to monitor and evaluate our operating results:
|
Year Ended December 31,
|
||||||||||||
|
(in thousands)
|
2025
|
2024
|
2023
|
|||||||||
|
Net premiums written:
|
||||||||||||
|
Commercial lines:
|
||||||||||||
|
Automobile
|
$
|
197,949
|
$
|
184,989
|
$
|
174,741
|
||||||
|
Workers’ compensation
|
92,464
|
103,533
|
107,598
|
|||||||||
|
Commercial multi-peril
|
221,283
|
213,959
|
195,632
|
|||||||||
|
Other
|
52,295
|
45,439
|
50,458
|
|||||||||
|
Total commercial lines
|
563,991
|
547,920
|
528,429
|
|||||||||
|
Personal lines:
|
||||||||||||
|
Automobile
|
208,077
|
243,036
|
215,957
|
|||||||||
|
Homeowners
|
122,999
|
140,613
|
139,688
|
|||||||||
|
Other
|
9,760
|
10,712
|
11,623
|
|||||||||
|
Total personal lines
|
340,836
|
394,361
|
367,268
|
|||||||||
|
Total net premiums written
|
$
|
904,827
|
$
|
942,281
|
$
|
895,697
|
||||||
|
Components of combined ratio:
|
||||||||||||
|
Loss ratio
|
61.3
|
%
|
64.5
|
%
|
69.1
|
%
|
||||||
|
Expense ratio
|
33.8
|
33.7
|
34.7
|
|||||||||
|
Dividend ratio
|
0.3
|
0.4
|
0.6
|
|||||||||
|
Combined ratio
|
95.4
|
%
|
98.6
|
%
|
104.4
|
%
|
||||||
|
Revenues:
|
||||||||||||
|
Net premiums earned:
|
||||||||||||
|
Commercial lines
|
$
|
555,873
|
$
|
539,683
|
$
|
533,029
|
||||||
|
Personal lines
|
365,311
|
396,968
|
349,042
|
|||||||||
|
Total net premiums earned
|
921,184
|
936,651
|
882,071
|
|||||||||
|
Net investment income
|
52,627
|
44,918
|
40,853
|
|||||||||
|
Investment gains
|
619
|
4,981
|
3,173
|
|||||||||
|
Other
|
3,584
|
3,055
|
1,241
|
|||||||||
|
Total revenues
|
$
|
978,014
|
$
|
989,605
|
$
|
927,338
|
||||||
|
Year Ended December 31,
|
||||||||||||
|
(in thousands)
|
2025
|
2024
|
2023
|
|||||||||
|
Components of net income:
|
||||||||||||
|
Underwriting income (loss):
|
||||||||||||
|
Commercial lines
|
$
|
4,672
|
$
|
5,826
|
$
|
(6,998
|
)
|
|||||
|
Personal lines
|
43,850
|
5,739
|
(35,118
|
)
|
||||||||
|
SAP underwriting income (loss)
|
48,522
|
11,565
|
(42,116
|
)
|
||||||||
|
GAAP adjustments
|
(5,849
|
)
|
1,331
|
3,735
|
||||||||
|
GAAP underwriting income (loss)
|
42,673
|
12,896
|
(38,381
|
)
|
||||||||
|
Net investment income
|
52,627
|
44,918
|
40,853
|
|||||||||
|
Investment gains
|
619
|
4,981
|
3,173
|
|||||||||
|
Other
|
1,674
|
(456
|
)
|
(582
|
)
|
|||||||
|
Income before income tax expense
|
97,593
|
62,339
|
5,063
|
|||||||||
|
Income tax expense
|
18,252
|
11,477
|
637
|
|||||||||
|
Net income
|
$
|
79,341
|
$
|
50,862
|
$
|
4,426
|
||||||
We prepare our consolidated financial statements on the basis of GAAP. Our insurance subsidiaries prepare financial statements based on SAP. SAP financial measures are considered non-GAAP financial measures under
applicable SEC rules because the SAP financial measures include or exclude certain items that the most comparable GAAP financial measures do not ordinarily include or exclude. Our calculation of non-GAAP financial measures may differ from similar
measures other companies use. As a result, investors should exercise caution when comparing our non-GAAP financial measures to the non-GAAP financial measures other companies use. The SAP financial measures we utilize are net premiums written and
statutory combined ratio.
Net Premiums Written
We define net premiums written as the amount of full-term premiums our insurance subsidiaries record for policies effective within a given period less premiums our insurance subsidiaries cede to reinsurers. Net
premiums earned is the most comparable GAAP financial measure to net premiums written. Net premiums earned represent the sum of the amount of net premiums written and the change in net unearned premiums during a given period. Our insurance
subsidiaries earn premiums and recognize them as revenue over the terms of their policies, which are one year or less in duration. Therefore, increases or decreases in net premiums earned generally reflect increases or decreases in net premiums
written in the preceding 12-month period compared to the comparable period one year earlier.
The following table provides a reconciliation of our net premiums earned to our net premiums written for 2025:
|
(in thousands)
|
Commercial Lines
|
Personal
Lines
|
Total
|
|||||||||
|
Net premiums earned
|
$
|
555,873
|
$
|
365,311
|
$
|
921,184
|
||||||
|
Change in net unearned premiums
|
8,118
|
(24,475
|
)
|
(16,357
|
)
|
|||||||
|
Net premiums written
|
$
|
563,991
|
$
|
340,836
|
$
|
904,827
|
||||||
The following table provides a reconciliation of our net premiums earned to our net premiums written for 2024:
|
(in thousands)
|
Commercial Lines
|
Personal
Lines
|
Total
|
|||||||||
|
Net premiums earned
|
$
|
539,683
|
$
|
396,968
|
$
|
936,651
|
||||||
|
Change in net unearned premiums
|
8,237
|
(2,607
|
)
|
5,630
|
||||||||
|
Net premiums written
|
$
|
547,920
|
$
|
394,361
|
$
|
942,281
|
||||||
The following table provides a reconciliation of our net premiums earned to our net premiums written for 2023:
|
(in thousands)
|
Commercial Lines
|
Personal
Lines
|
Total
|
|||||||||
|
Net premiums earned
|
$
|
533,029
|
$
|
349,042
|
$
|
882,071
|
||||||
|
Change in net unearned premiums
|
(4,600
|
)
|
18,226
|
13,626
|
||||||||
|
Net premiums written
|
$
|
528,429
|
$
|
367,268
|
$
|
895,697
|
||||||
Statutory Combined Ratio
The combined ratio is a standard measurement of underwriting profitability for an insurance company. The combined ratio does not reflect investment income, net investment gains or losses, federal income taxes or other
non-operating income or expense. A combined ratio of less than 100% generally indicates underwriting profitability.
The statutory combined ratio is a non-GAAP financial measure that is based upon amounts determined under SAP. We calculate our statutory combined ratio as the sum of:
| • |
the statutory loss ratio, which is the ratio of calendar-year net incurred losses and loss expenses to net premiums earned;
|
| • |
the statutory expense ratio, which is the ratio of expenses incurred for net commissions, premium taxes and underwriting expenses to net premiums written; and
|
| • |
the statutory dividend ratio, which is the ratio of dividends to holders of workers’ compensation policies to net premiums earned.
|
The calculation of our statutory combined ratio differs from the calculation of our GAAP combined ratio. In calculating our GAAP combined ratio, we do not deduct installment payment fees from incurred expenses, and we
base the expense ratio on net premiums earned instead of net premiums written. Differences between our GAAP loss ratio and our statutory loss ratio result from anticipating salvage and subrogation recoveries for our GAAP loss ratio but not for our
statutory loss ratio.
The following table presents comparative details with respect to our GAAP and statutory combined ratios for the years ended December 31, 2025, 2024 and 2023:
|
Year Ended December 31,
|
||||||||||||
|
2025
|
2024
|
2023
|
||||||||||
|
GAAP Combined Ratios (Total Lines)
|
||||||||||||
|
Loss ratio - core losses
|
51.4
|
%
|
54.0
|
%
|
57.5
|
%
|
||||||
|
Loss ratio - weather-related losses
|
6.2
|
7.2
|
8.3
|
|||||||||
|
Loss ratio - large fire losses
|
4.8
|
4.9
|
5.2
|
|||||||||
|
Loss ratio - net prior-year reserve development
|
-1.1
|
-1.6
|
-1.9
|
|||||||||
|
Loss ratio
|
61.3
|
64.5
|
69.1
|
|||||||||
|
Expense ratio
|
33.8
|
33.7
|
34.7
|
|||||||||
|
Dividend ratio
|
0.3
|
0.4
|
0.6
|
|||||||||
|
Combined ratio
|
95.4
|
%
|
98.6
|
%
|
104.4
|
%
|
||||||
|
|
||||||||||||
|
Statutory Combined Ratios
|
||||||||||||
|
Commercial lines:
|
||||||||||||
|
Automobile
|
97.9
|
%
|
102.6
|
%
|
97.3
|
%
|
||||||
|
Workers’ compensation
|
105.5
|
104.4
|
96.6
|
|||||||||
|
Commercial multi-peril
|
94.0
|
95.0
|
112.3
|
|||||||||
|
Other
|
106.3
|
80.0
|
85.5
|
|||||||||
|
Total commercial lines
|
98.5
|
98.2
|
101.6
|
|||||||||
|
Personal lines:
|
||||||||||||
|
Automobile
|
86.4
|
97.4
|
109.7
|
|||||||||
|
Homeowners
|
96.9
|
99.6
|
108.6
|
|||||||||
|
Other
|
55.0
|
99.5
|
75.8
|
|||||||||
|
Total personal lines
|
89.3
|
98.3
|
108.2
|
|||||||||
|
Total commercial and personal lines
|
95.0
|
98.3
|
104.2
|
|||||||||
Results of Operations
YEAR ENDED DECEMBER 31, 2025 COMPARED TO YEAR ENDED DECEMBER 31, 2024
Net Premiums Earned
Our insurance subsidiaries’ net premiums earned decreased to $921.2 million for 2025, a decrease of $15.5 million, or 1.7%, compared to 2024, primarily reflecting lower new
business writings, offset partially by solid premium retention and renewal premium increases. Our insurance subsidiaries earn premiums and recognize them as income over the terms of the policies they issue. Such terms are generally one year or less
in duration. Therefore, increases or decreases in net premiums earned generally reflect increases or decreases in net premiums written in the preceding twelve-month period compared to the same period one year earlier.
Net Premiums Written
Our insurance subsidiaries’ 2025 net premiums written decreased 4.0% to $904.8 million, compared to $942.3 million for 2024. Commercial lines net premiums written increased $16.0 million, or 2.9%, for 2025 compared to
2024. We attribute the increase in commercial lines net premiums written primarily to solid premium retention and a continuation of renewal premium increases in lines other than workers’ compensation, offset partially by lower new business
writings. Personal lines net premiums written decreased $53.5 million, or 13.6%, for 2025 compared to 2024. We attribute the decrease in personal lines net premiums written primarily to planned attrition due to lower new business writings and
strategic non-renewal actions, offset partially by a continuation of renewal premium rate increases and solid retention.
Investment Income
For 2025, our net investment income increased 17.2% to $52.6 million, compared to $44.9 million for 2024, due primarily to higher average invested assets and an increase in the average investment yield compared to the
prior year.
Net Investment Gains
Our net investment gains for 2025 were $619,342, compared to $5.0 million for 2024. The net investment gains for 2025 and 2024 were primarily related to increases in the market value of the equity securities held at
the end of the respective periods, with the increase in 2025 offset largely by net realized investment losses on the strategic sales of available-for-sale fixed-maturity securities. We did not recognize any impairment losses during 2025 or 2024.
Losses and Loss Expenses
Our insurance subsidiaries’ loss ratio, which is the ratio of incurred losses and loss expenses to premiums earned, was 61.3% for 2025, compared to 64.5% for 2024. Our insurance subsidiaries’ commercial lines loss
ratio increased slightly to 62.1% for 2025, compared to 62.0% for 2024. The commercial multi-peril loss ratio decreased to 56.4% for 2025, compared to 57.5% for 2024. The commercial automobile loss ratio decreased to 63.5% for 2025, compared to
68.5% for 2024. The workers’ compensation loss ratio decreased to 67.4% for 2025, compared to 67.7% for 2024. The personal lines loss ratio decreased to 60.0% for 2025, compared to 68.0% for 2024, due primarily to the continued benefit of earned
premium rate increases and lower weather-related losses. The personal automobile loss ratio decreased to 57.7% for 2025, compared to 68.5% for 2024. The homeowners loss ratio decreased to 66.0% for 2025, compared to 66.7% for 2024. Our insurance
subsidiaries experienced favorable loss reserve development of approximately $10.3 million, or 1.1 percentage points of the loss ratio, during 2025 in their reserves for prior accident years, compared to
approximately $15.0 million, or 1.6 percentage points of the loss ratio, during 2024. The favorable loss reserve development in 2025 resulted primarily from lower-than-expected loss emergence in the commercial multi-peril, personal automobile,
commercial automobile, homeowners, other personal lines and workers’ compensation lines of business, offset partially by unfavorable development in the other commercial lines of business (which is primarily umbrella liability). Weather-related
losses of $56.9 million, or 6.2 percentage points of the loss ratio, for 2025 decreased from $67.7 million, or 7.2 percentage points of the loss ratio, for 2024, with the decrease primarily impacting the commercial multi-peril and homeowners lines
of business. Large fire losses, which we define as individual fire losses in excess of $50,000, were $43.9 million, or 4.8 percentage points of the loss ratio, for 2025, compared to $45.8 million, or 4.9 percentage points of the loss ratio, for
2024.
Underwriting Expenses
Our insurance subsidiaries’ expense ratio, which is the ratio of policy acquisition and other underwriting expenses to premiums earned, was 33.8% for 2025, compared to 33.7% for 2024. The impact from costs that Donegal
Mutual Insurance Company allocated to our insurance subsidiaries related to its systems modernization project represented approximately 1.2 percentage points of the expense ratio for 2025.
Policyholder Dividends
Our insurance subsidiaries pay policyholder dividends primarily on workers’ compensation policies on a sliding scale based on the profitability of a given policy.
Combined Ratio
Our insurance subsidiaries’ combined ratio was 95.4% and 98.6% for 2025 and 2024, respectively. The combined ratio represents the sum of the loss ratio, the expense ratio and the dividend ratio, which is the ratio of
workers’ compensation policy dividends incurred to premiums earned. We attribute the decrease in our combined ratio primarily to the decrease in the loss ratio.
Interest Expense
Our interest expense for 2025 increased to $1.4 million, compared to $946,020 for 2024. We attribute the increase to higher interest rates on borrowings under our lines of credit during 2025 compared to 2024.
Income Taxes
Our income tax expense was $18.3 million for 2025, compared to $11.5 million for 2024. Our effective tax rate for 2025 and 2024 was 18.7% and 18.4%, respectively.
Net Income and Earnings Per Share
Our net income for 2025 was $79.3 million, or $2.18 per share of Class A common stock on a diluted basis and $2.01 per share of Class B common stock, compared to $50.9 million, or $1.53 per share of Class A common
stock on a diluted basis and $1.38 per share of Class B common stock, for 2024. We had 31.4 million and 30.0 million Class A shares outstanding at December 31, 2025 and 2024, respectively. We had 5.6 million Class B shares outstanding for both
periods. There are no outstanding securities that dilute our shares of Class B common stock.
Book Value Per Share
Our stockholders’ equity increased by $94.6 million during 2025, primarily due to our net income, after-tax unrealized gains within our available-for-sale fixed-maturity portfolio and other increases, offset partially
by the cash dividends we declared during the year, resulting in an increase in our book value per share to $17.33 at December 31, 2025, compared to $15.36 a year earlier.
YEAR ENDED DECEMBER 31, 2024 COMPARED TO YEAR ENDED DECEMBER 31, 2023
Net Premiums Earned
Our insurance subsidiaries’ net premiums earned increased to $936.7 million for 2024, an increase of $54.6 million, or 6.2%, compared to 2023, primarily reflecting solid
premium retention and renewal premium increases. Our insurance subsidiaries earn premiums and recognize them as income over the terms of the policies they issue. Such terms are generally one year or less in duration. Therefore, increases or
decreases in net premiums earned generally reflect increases or decreases in net premiums written in the preceding twelve-month period compared to the same period one year earlier.
Net Premiums Written
Our insurance subsidiaries’ 2024 net premiums written increased 5.2% to $942.3 million, compared to $895.7 million for 2023. Commercial lines net premiums written increased $19.5 million, or 3.7%, for 2024 compared to
2023. We attribute the increase in commercial lines net premiums written primarily to strong premium retention and a continuation of renewal premium increases in lines other than workers’ compensation, offset partially by planned attrition in
states we exited or classes of business we have targeted for profit improvement. Personal lines net premiums written increased $27.1 million, or 7.4%, for 2024 compared to 2023. We attribute the increase in personal lines net premiums written
primarily to renewal premium rate increases and solid policy retention, offset partially by planned attrition due to non-renewal actions and lower new business writings.
Investment Income
For 2024, our net investment income increased 10.0% to $44.9 million, compared to $40.9 million for 2023, due primarily to higher average reinvestment yields and higher average invested assets for 2024 compared to
2023.
Net Investment Gains
Our net investment gains for 2024 were $5.0 million, compared to $3.2 million for 2023. The net investment gains for 2024 and 2023 were primarily related to increases in the market value of the equity securities held
at the end of the respective periods. We did not recognize any impairment losses during 2024 or 2023.
Losses and Loss Expenses
Our insurance subsidiaries’ loss ratio, which is the ratio of incurred losses and loss expenses to premiums earned, was 64.5% for 2024, compared to 69.1% for 2023. Our insurance subsidiaries’ commercial lines loss
ratio decreased to 62.0% for 2024, compared to 64.8% for 2023. This decrease resulted primarily from the commercial multi-peril loss ratio decreasing to 57.5% for 2024, compared to 73.1% for 2023, primarily due to a decrease in severity of
non-weather claims, offset partially by increases in the commercial automobile and workers’ compensation loss ratios due primarily to increases in loss emergence for prior accident years. The commercial automobile loss ratio increased to 68.5% for
2024, compared to 63.0% for 2023. The workers’ compensation loss ratio increased to 67.7% for 2024, compared to 59.0% for 2023. The personal lines loss ratio decreased to 68.0% for 2024, compared to 75.6% for 2023, due primarily to increases in net
premiums earned related to premium rate increases. The personal automobile loss ratio decreased to 68.5% for 2024, compared to 78.5% for 2023. The homeowners loss ratio decreased to 66.7% for 2024, compared to 73.6% for 2023. Our insurance
subsidiaries experienced favorable loss reserve development of approximately $15.0 million, or 1.6 percentage points of the loss ratio, during 2024 in their reserves for prior accident years, compared to
approximately $16.7 million, or 1.9 percentage points of the loss ratio, during 2023. The favorable loss reserve development in 2024 resulted primarily from lower-than-expected loss emergence in the commercial multi-peril, personal automobile and
homeowner lines of business, offset partially by higher-than-expected loss emergence in the workers’ compensation and commercial automobile lines of business, for accident years prior to 2024. Weather-related losses of $67.7 million, or 7.2
percentage points of the loss ratio, for 2024 increased from $72.9 million, or 8.3 percentage points of the loss ratio, for 2023, with the decrease primarily impacting the commercial multi-peril and homeowners lines of business. Large fire losses,
which we define as individual fire losses in excess of $50,000, were $45.8 million, or 4.9 percentage points of the loss ratio, for 2024, compared to $45.4 million, or 5.2 percentage points of the loss ratio, for 2023.
Underwriting Expenses
Our insurance subsidiaries’ expense ratio, which is the ratio of policy acquisition and other underwriting expenses to premiums earned, was 33.7% for 2024, compared to 34.7% for 2023. We attribute the decrease to the
impacts of various expense reduction initiatives, including agency incentive program revisions, commission schedule adjustments, targeted staffing reductions, and hiring restrictions for open employment positions, among others. These impacts were
offset partially by an increase in underwriting-based incentive costs as well as higher technology systems-related expenses that were primarily due to increased costs related to our ongoing systems modernization project, a portion of which Donegal
Mutual Insurance Company allocates to our insurance subsidiaries. We expect the impact from allocated costs from Donegal Mutual Insurance Company to our insurance subsidiaries related to the ongoing systems modernization project peaked at
approximately 1.3 percentage points of the expense ratio for 2024 and will subside gradually in 2025 and subsequent years.
Policyholder Dividends
Our insurance subsidiaries pay policyholder dividends primarily on workers’ compensation policies on a sliding scale based on the profitability of a given policy.
Combined Ratio
Our insurance subsidiaries’ combined ratio was 98.6% and 104.4% for 2024 and 2023, respectively. The combined ratio represents the sum of the loss ratio, the expense ratio and the dividend ratio, which is the ratio of
workers’ compensation policy dividends incurred to premiums earned. We attribute the decrease in our combined ratio primarily to the decreases in the loss and expense ratios.
Interest Expense
Our interest expense for 2024 increased to $946,020, compared to $619,813 for 2023. We attribute the increase to higher interest rates on borrowings under our lines of credit during 2024 compared to 2023.
Income Taxes
Our income tax expense was $11.5 million for 2024, compared to $637,972 for 2023. Our effective tax rate for 2024 and 2023 was 18.4% and 12.6%, respectively.
Net Income and Earnings Per Share
Our net income for 2024 was $50.9 million, or $1.53 per share of Class A common stock on a diluted basis and $1.38 per share of Class B common stock, compared to $4.4 million, or $0.14 per share of Class A common stock
on a diluted basis and $0.11 per share of Class B common stock, for 2023. We had 30.0 million and 27.8 million Class A shares outstanding at December 31, 2024 and 2023, respectively. We had 5.6 million Class B shares outstanding for both periods.
There are no outstanding securities that dilute our shares of Class B common stock.
Book Value Per Share
Our stockholders’ equity increased by $66.0 million during 2024, primarily due to our net income, stock issuances under our stock compensation plans and other increases exceeding the cash dividends we declared during
the year and resulting in an increase in our book value per share to $15.36 at December 31, 2024, compared to $14.39 a year earlier.
Financial Condition
Liquidity and Capital Resources
Liquidity is a measure of an entity’s ability to secure enough cash to meet its contractual obligations and operating needs as they arise. Our major sources of funds from operations are the net cash flows generated
from our insurance subsidiaries’ underwriting results, investment income and maturing investments.
We have historically generated sufficient net positive cash flow from our operations to fund our commitments and build our investment portfolio, thereby increasing future investment returns. The pooling agreement with
Donegal Mutual historically has been cash flow positive because of the profitability of the underwriting pool. Because we settle the pool monthly, our cash flows are substantially similar to the cash flows that would result from the underwriting of
direct business. We maintain a high degree of liquidity in our investment portfolio in the form of marketable fixed maturities, equity securities and short-term investments. We structure our fixed-maturity investment portfolio following a
“laddering” approach so that projected cash flows from investment income and principal maturities are evenly distributed from a timing perspective. This laddering approach provides an additional measure of liquidity to meet our obligations and the
obligations of our insurance subsidiaries should an unexpected variation occur in the future. Net cash flows provided by operating activities in 2025, 2024 and 2023 were $70.2 million, $67.4 million and $28.6 million, respectively.
At December 31, 2025, we had no outstanding borrowings under our line of credit with M&T and had the ability to borrow up to $20.0 million at interest rates equal to the then-current Term SOFR rate plus 2.11%. At
December 31, 2025, Atlantic States had a $35.0 million outstanding advance with the FHLB of Pittsburgh that carries a fixed interest rate of 3.806% and is due in September 2026. We discuss in Note 9 – Borrowings our estimate of the timing of the
amounts payable for the borrowings under our lines of credit based on their contractual maturities.
We estimate the timing of claim payments associated with the liabilities for losses and loss expenses of our insurance subsidiaries based on historical experience and expectations of future payment patterns. Amounts
Atlantic States assumes pursuant to the pooling agreement with Donegal Mutual represent a substantial portion of our insurance subsidiaries’ gross liabilities for losses and loss expenses, and amounts Atlantic States cedes pursuant to the pooling
agreement represent a substantial portion of our insurance subsidiaries’ reinsurance recoverable on unpaid losses and loss expenses. We include cash settlement of Atlantic States’ assumed liabilities from the pool in monthly settlements of pooled
activity, as we net amounts ceded to and assumed from the pool. Although Donegal Mutual and we do not anticipate any changes in the pool participation levels in the foreseeable future, any such change would be prospective in nature and therefore
would not impact the timing of expected payments by Atlantic States for its percentage share of pooled losses occurring in periods prior to the effective date of such change.
The cash dividends we declared to our stockholders totaled $26.3 million, $23.2 million and $22.2 million in 2025, 2024 and 2023, respectively. There are no regulatory
restrictions on our payment of dividends to our stockholders, although there are restrictions under applicable state laws on the payment of dividends from our insurance subsidiaries to us, which is a significant source of cash for payment of
stockholder dividends by us. Our insurance subsidiaries are required by law to maintain certain minimum surplus on a statutory basis and are subject to regulations under which their payment of dividends from statutory surplus is restricted and may
require prior approval of their domiciliary insurance regulatory authorities. Our insurance subsidiaries are also subject to risk-based capital (“RBC”) requirements. The amount of statutory capital and surplus necessary for our insurance
subsidiaries to satisfy regulatory requirements, including the RBC requirements, was not significant in relation to our insurance subsidiaries’ statutory capital and surplus at December 31, 2025. Amounts available for distribution to us as
dividends from our insurance subsidiaries without prior approval of insurance regulatory authorities in 2026 are approximately $50.8 million from Atlantic States, $10.2 million from MICO and $5.4 million from Peninsula, or a total of approximately
$66.4 million.
Investments
At December 31, 2025 and 2024, our investment portfolio of primarily investment-grade bonds, common stock, short-term investments and cash totaled $1.5 billion and $1.4 billion, respectively, representing 64.0% and
61.6%, respectively, of our total assets. See “Business - Investments” for more information.
|
December 31,
|
||||||||||||||||
|
2025
|
2024
|
|||||||||||||||
|
Percent of
|
Percent of
|
|||||||||||||||
|
(dollars in thousands)
|
Amount
|
Total
|
Amount
|
Total
|
||||||||||||
|
Fixed maturities:
|
||||||||||||||||
|
Total held to maturity
|
$
|
776,447
|
51.8
|
%
|
$
|
705,714
|
51.0
|
%
|
||||||||
|
Total available for sale
|
640,723
|
42.7
|
617,892
|
44.6
|
||||||||||||
|
Total fixed maturities
|
1,417,170
|
94.5
|
1,323,606
|
95.6
|
||||||||||||
|
Equity securities
|
44,370
|
3.0
|
36,808
|
2.6
|
||||||||||||
|
Short-term investments
|
38,713
|
2.5
|
24,558
|
1.8
|
||||||||||||
|
Total investments
|
$
|
1,500,253
|
100.0
|
%
|
$
|
1,384,972
|
100.0
|
%
|
||||||||
The carrying value of our fixed maturity investments represented 94.5% and 95.6% of our total invested assets at December 31, 2025 and 2024, respectively.
Our fixed maturity investments consisted of high-quality marketable bonds, of which 96.4% and 95.6% were rated at investment-grade levels at December 31, 2025 and 2024, respectively.
At December 31, 2025, the net unrealized loss on our available-for-sale fixed maturity investments, net of deferred taxes, amounted to $7.6 million, compared to $27.4 million at December 31, 2024.
Impact of Inflation
Our insurance subsidiaries establish their property and casualty insurance premium rates before they know the amount of losses and loss settlement expenses or the extent to which inflation may impact such expenses.
Consequently, our insurance subsidiaries attempt, in establishing rates, to anticipate the potential future impact of inflation. Our insurance subsidiaries account for inflation in the reserving function through analysis of costs and trends and
reviews of historical reserving results.
Impact of Changing Climate Conditions
Insured losses from severe weather events could significantly impact the underwriting results of our insurance subsidiaries. Losses from catastrophic events are a function of both the extent of our insurance
subsidiaries’ exposures, the frequency and severity of the events themselves and the level of reinsurance coverage our insurance subsidiaries purchase. The increased frequency and severity of weather-related catastrophes and other losses, such as
from wildfires and flooding, incurred by the industry in recent years may be indicative of changing weather patterns due to climate change. Should those patterns continue to emerge, increased weather-related catastrophes in the states in which our
insurance subsidiaries operate would lead to higher overall losses that they may be unable to offset through pricing actions.
Our insurance subsidiaries seek to reduce their exposure to catastrophe losses through their underwriting strategies and their purchase of catastrophe reinsurance. While the emerging science regarding climate change
and its connection to extreme weather events continues to be studied, climate change, to the extent it produces rising temperatures and changes in weather patterns, could affect the frequency and severity of weather events and other losses and thus
impact the affordability and availability of catastrophe reinsurance coverage for our insurance subsidiaries. Our insurance subsidiaries’ ability to appropriately manage catastrophe risk depends partially on catastrophe models, which rely on
historical data that might not be representative of the frequency and severity of future events. Such models might also be unable to anticipate the uncertain impact of changing climate conditions that tend to occur gradually over time. Because the
policies of our insurance subsidiaries renew not less frequently than annually, our insurance subsidiaries have the ability to respond to the impact of changing climate conditions through adjustments to their underwriting standards, pricing, and
policy terms and conditions, subject to applicable regulatory approvals.
Changing climate conditions could lead to new or revised regulations with which our insurance subsidiaries would have to comply. Such regulations could impact the ability of our insurance subsidiaries to manage their
exposures in areas impacted by increased weather activity, require our insurance companies to alter the terms and conditions of their policies or impact the ability of our insurance subsidiaries to obtain sufficient pricing increases to offset
higher loss activity.
Impact of New Accounting Standards
In September 2016, the Financial Accounting Standards Board (the “FASB”) issued guidance that amended previous guidance on the impairment of financial instruments by adding an impairment model that requires an entity
to recognize expected credit losses as an allowance rather than impairments as credit losses are incurred. The intent of this guidance is to reduce complexity and result in a more timely recognition of expected credit losses. In November 2019, the
FASB issued guidance that delayed the effective date for “smaller reporting companies,” as defined in Item 10(f)(1) of Regulation S-K, to annual and interim reporting periods beginning after December 15, 2022 from December 15, 2019. We were a
smaller reporting company at the time this guidance was issued, and our adoption of this guidance on January 1, 2023 resulted in an after-tax decrease in retained earnings of $1.9 million. The adoption of this guidance did not have a significant
impact on our results of operations or cash flows.
In November 2023, the FASB issued guidance that amended previous guidance on the disclosure of reportable segments. The guidance requires disclosure of incremental segment information including the title and position
of the individual identified as the chief operating decision maker, a narrative explanation of how the chief operating decision maker uses each reported measure of a segment’s profit or loss in assessing performance and determining how to allocate
resources, as well as quantification of significant segment expenses and other items. We refer to Note 18 - Segment Information for further information and disclosure of items required within the amended and enhanced guidance. The adoption of this
guidance did not have an impact on our financial position, results of operations or cash flows.
In December 2023, the FASB issued guidance to enhance the transparency and usefulness of income tax disclosures. The guidance requires disclosure of specific categories in the rate reconciliation table and additional
information for reconciling items that meet a quantitative threshold of equal to or greater than 5 percent of the amount computed by multiplying pretax income or loss by the applicable statutory income tax rate. The guidance also requires
disaggregated disclosure of the amount of income taxes paid for federal, state and foreign taxes. We refer to Note 11- Income Taxes for further information and disclosure of items required within the amended and enhanced guidance. The adoption of
this guidance did not have an impact on our financial position, results of operations or cash flows.
In November 2024, the FASB issued guidance requiring disaggregated disclosure of income statement expenses in the notes to financial statements. The guidance requires disclosure of certain expenses, including employee
compensation, depreciation and selling expenses. The guidance will not impact current income statement expense captions that industry-specific guidance requires. The guidance is effective for annual reporting periods beginning after December 15,
2026. The adoption of this guidance will not have an impact on our financial position, results of operations or cash flows.
Off-Balance Sheet Arrangements
As of December 31, 2025 and 2024, we did not have any off-balance sheet arrangements as defined in Item 303(a)(4)(ii) of Regulation S-K.
We are exposed to the impact of interest rate changes, to changes in fair values of investments and to credit risk.
In the normal course of business, we employ established policies and procedures to manage our exposure to changes in interest rates, fluctuations in the fair market value of our debt and equity securities and credit
risk. We seek to mitigate these risks by various actions we describe below.
Interest Rate Risk
Our exposure to market risk for a change in interest rates is concentrated in our investment portfolio. We monitor this exposure through periodic reviews of our asset and liability positions. We regularly monitor
estimates of cash flows and the impact of interest rate fluctuations relating to our investment portfolio. Generally, we do not hedge our exposure to interest rate risk because we have the capacity to, and do, hold fixed-maturity investments to
maturity.
Principal cash flows and related weighted-average interest rates by stated maturity dates for the financial instruments we held at December 31, 2025 that are sensitive to interest rates are as follows:
|
(in thousands)
|
Principal
Cash Flows
|
Weighted-Average
Interest Rate
|
||||||
|
Fixed-maturity and short-term investments:
|
||||||||
|
2026
|
$
|
28,623
|
4.33
|
%
|
||||
|
2027
|
35,649
|
3.86
|
||||||
|
2028
|
44,613
|
4.61
|
||||||
|
2029
|
67,058
|
3.49
|
||||||
|
2030
|
75,024
|
3.82
|
||||||
|
Thereafter
|
1,191,581
|
4.01
|
||||||
|
Total
|
$
|
1,442,548
|
||||||
|
Fair value
|
$
|
1,411,094
|
||||||
|
Debt:
|
||||||||
|
2026
|
$
|
35,000
|
3.81
|
%
|
||||
|
Total
|
$
|
35,000
|
||||||
|
Fair value
|
$
|
35,000
|
||||||
Actual cash flows from investments may differ from those depicted above as a result of calls and prepayments.
Equity Price Risk
Our portfolio of equity securities, which we carry on our consolidated balance sheets at estimated fair value, has exposure to price risk, which is the risk of potential loss in estimated fair value resulting from an
adverse change in prices. Our objective is to mitigate this risk and to earn competitive relative returns by investing in a diverse portfolio of high-quality, liquid securities.
Credit Risk
Our objective is to earn competitive returns by investing in a diversified portfolio of securities. Our portfolio of fixed maturity securities and, to a lesser extent, short-term investments is subject to credit risk.
We define this risk as the potential loss in fair value resulting from adverse changes in the borrower’s ability to repay the debt. We manage this risk by performing an analysis of prospective investments and through regular reviews of our
portfolio by our investment personnel. We also limit the amount of our total investment portfolio that we invest in any one security.
Our insurance subsidiaries provide property and liability insurance coverages through independent insurance agencies located throughout their operating areas. Our insurance subsidiaries bill the majority of this
business directly to the insured, although our insurance subsidiaries bill a portion of their commercial business through their agents, to whom they extend credit in the normal course of business.
Because the pooling agreement does not relieve Atlantic States of primary liability as the originating insurer, Atlantic States is subject to a concentration of credit risk arising from the business Atlantic States
cedes to Donegal Mutual. Our insurance subsidiaries maintain reinsurance agreements with Donegal Mutual and with a number of other major unaffiliated authorized reinsurers. To the extent that a reinsurer cannot pay losses for which it is liable
under the terms of a reinsurance agreement with one or more of our insurance subsidiaries, our insurance subsidiaries retain continued liability for such losses.
| Index to Consolidated Financial Statements and Schedule | |
| 65 | |
| 66 | |
| 67 | |
| 68 | |
| 69 | |
| 108 | |
| Schedule: | |
| 116 |
|
December 31,
|
||||||||
|
2025
|
2024
|
|||||||
|
Assets
|
||||||||
|
Investments
|
||||||||
|
Fixed maturities
|
||||||||
| Held to maturity, at amortized cost (fair value $ |
$ |
|
$ |
|
||||
| Available for sale, at fair value (amortized cost $ |
|
|
||||||
|
Equity securities, at fair value
|
|
|
||||||
|
Short-term investments, at cost, which approximates fair value
|
|
|
||||||
|
Total investments
|
|
|
||||||
|
Cash
|
|
|
||||||
|
Accrued investment income
|
|
|
||||||
|
Premiums receivable
|
|
|
||||||
| Reinsurance receivable (net of allowance for expected credit losses of $ |
|
|
||||||
|
Deferred policy acquisition costs
|
|
|
||||||
|
Deferred tax asset, net
|
|
|
||||||
|
Prepaid reinsurance premiums
|
|
|
||||||
|
Property and equipment, net
|
|
|
||||||
|
Accounts receivable - securities
|
|
|
||||||
|
Federal income taxes recoverable
|
|
|
||||||
|
Due from affiliate
|
|
|
||||||
|
Goodwill
|
|
|
||||||
|
Other intangible assets
|
|
|
||||||
|
Other
|
|
|
||||||
|
Total assets
|
$
|
|
$
|
|
||||
|
|
||||||||
|
Liabilities and Stockholders’ Equity
|
||||||||
|
Liabilities
|
||||||||
|
Losses and loss expenses
|
$
|
|
$
|
|
||||
|
Unearned premiums
|
|
|
||||||
|
Accrued expenses
|
|
|
||||||
|
Reinsurance balances payable
|
|
|
||||||
|
Borrowings under lines of credit
|
|
|
||||||
|
Cash dividends declared to stockholders
|
|
|
||||||
|
Federal income taxes payable
|
|
|
||||||
|
Other
|
|
|
||||||
|
Total liabilities
|
|
|
||||||
|
Stockholders’ Equity
|
||||||||
| Preferred stock, $ |
|
|
||||||
| Class A common stock, $ |
|
|
||||||
| Class B common stock, $ |
|
|
||||||
|
Additional paid-in capital
|
|
|
||||||
|
Accumulated other comprehensive loss
|
( |
)
|
( |
)
|
||||
|
Retained earnings
|
|
|
||||||
|
Treasury stock, at cost
|
( |
)
|
( |
)
|
||||
|
Total stockholders’ equity
|
|
|
||||||
|
Total liabilities and stockholders’ equity
|
$
|
|
$
|
|
||||
See accompanying notes to consolidated financial statements.
|
Years Ended December 31,
|
||||||||||||
|
2025
|
2024
|
2023
|
||||||||||
|
Statements of Income
|
||||||||||||
|
Revenues
|
||||||||||||
| Net premiums earned (includes affiliated reinsurance of $ |
$ |
|
$ |
|
$ |
|
||||||
|
Investment income, net of investment expenses
|
|
|
|
|||||||||
|
Installment payment fees
|
|
|
|
|||||||||
|
Lease income
|
|
|
|
|||||||||
| Net investment gains (includes ($ |
|
|
|
|||||||||
|
Total revenues
|
|
|
|
|||||||||
|
Expenses
|
||||||||||||
| Net losses and loss expenses (includes affiliated reinsurance of $ |
|
|
|
|||||||||
|
Amortization of deferred policy acquisition costs
|
|
|
|
|||||||||
|
Other underwriting expenses
|
|
|
|
|||||||||
|
Policyholder dividends
|
|
|
|
|||||||||
|
Interest
|
|
|
|
|||||||||
|
Other, net
|
|
|
|
|||||||||
|
Total expenses
|
|
|
|
|||||||||
|
Income before income tax expense
|
|
|
|
|||||||||
| Income tax expense (includes $ |
|
|
|
|||||||||
|
Net income
|
$
|
|
$
|
|
$
|
|
||||||
|
Basic earnings per common share:
|
||||||||||||
|
Class A common stock
|
$
|
|
$
|
|
$
|
|
||||||
|
Class B common stock
|
$
|
|
$
|
|
$
|
|
||||||
|
Diluted earnings per common share:
|
||||||||||||
|
Class A common stock
|
$
|
|
$
|
|
$
|
|
||||||
|
Class B common stock
|
$
|
|
$
|
|
$
|
|
||||||
|
Statements of Comprehensive Income
|
||||||||||||
|
Net income
|
$
|
|
$
|
|
$
|
|
||||||
|
Other comprehensive income, net of tax
|
||||||||||||
|
Unrealized gain on securities:
|
||||||||||||
| Unrealized holding gain arising during the period, net of income tax expense of $ |
|
|
|
|||||||||
| Reclassification adjustment for losses included in net income, net of income tax benefit of $ |
|
|
|
|||||||||
|
Other comprehensive income
|
|
|
|
|||||||||
|
Comprehensive income
|
$
|
|
$
|
|
$
|
|
||||||
See accompanying notes to consolidated financial statements.
|
Common Stock
|
||||||||||||||||||||||||||||||||||||
|
Class A Shares
|
Class B Shares
|
Class A Amount
|
Class B Amount
|
Additional Paid-In Capital
|
Accumulated Other Comprehensive Loss
|
Retained Earnings
|
Treasury Stock
|
Total Stockholders’ Equity
|
||||||||||||||||||||||||||||
|
Balance, January 1, 2023
|
|
|
$
|
|
$
|
|
$
|
|
$
|
( |
)
|
$
|
|
$
|
( |
)
|
$
|
|
||||||||||||||||||
|
Issuance of common stock (stock compensation plans)
|
|
|
|
|
||||||||||||||||||||||||||||||||
|
Stock-based compensation
|
|
|
|
|
||||||||||||||||||||||||||||||||
|
Net income
|
|
|
||||||||||||||||||||||||||||||||||
|
Cash dividends
|
( |
)
|
( |
)
|
||||||||||||||||||||||||||||||||
|
Grant of stock options
|
|
( |
)
|
|
||||||||||||||||||||||||||||||||
|
Cumulative effect of adoption of updated guidance for credit losses at January 1, 2023
|
( |
)
|
( |
)
|
||||||||||||||||||||||||||||||||
|
Reclassification of held-to-maturity transfer
|
|
( |
)
|
|
||||||||||||||||||||||||||||||||
|
Other comprehensive income
|
|
|
||||||||||||||||||||||||||||||||||
|
Balance, December 31, 2023
|
|
|
$
|
|
$
|
|
$
|
|
$
|
( |
)
|
$
|
|
$
|
( |
)
|
$
|
|
||||||||||||||||||
|
Issuance of common stock (stock compensation plans)
|
|
|
|
|
||||||||||||||||||||||||||||||||
|
Stock-based compensation
|
|
|
|
|
||||||||||||||||||||||||||||||||
|
Net income
|
|
|
||||||||||||||||||||||||||||||||||
|
Cash dividends
|
( |
)
|
( |
)
|
||||||||||||||||||||||||||||||||
|
Grant of stock options
|
|
( |
)
|
|
||||||||||||||||||||||||||||||||
|
Other comprehensive income
|
|
|
||||||||||||||||||||||||||||||||||
|
Balance, December 31, 2024
|
|
|
$
|
|
$
|
|
$
|
|
$
|
( |
)
|
$
|
|
$
|
( |
)
|
$
|
|
||||||||||||||||||
|
Issuance of common stock (stock compensation plans)
|
|
|
|
|
||||||||||||||||||||||||||||||||
|
Stock-based compensation
|
|
|
|
|
||||||||||||||||||||||||||||||||
|
Net income
|
|
|
||||||||||||||||||||||||||||||||||
|
Cash dividends
|
( |
)
|
( |
)
|
||||||||||||||||||||||||||||||||
|
Grant of stock options
|
|
( |
)
|
|
||||||||||||||||||||||||||||||||
|
Other comprehensive income
|
|
|
||||||||||||||||||||||||||||||||||
|
Balance, December 31, 2025
|
|
|
$
|
|
$
|
|
$
|
|
$
|
( |
)
|
$
|
|
$
|
( |
)
|
$
|
|
||||||||||||||||||
See accompanying notes to consolidated financial statements.
|
Years Ended December 31,
|
||||||||||||
|
2025
|
2024
|
2023
|
||||||||||
|
Cash Flows from Operating Activities:
|
||||||||||||
|
Net income
|
$
|
|
$
|
|
$
|
|
||||||
|
Adjustments to reconcile net income to net cash provided by operating activities:
|
||||||||||||
|
Depreciation, amortization and other non-cash items
|
|
|
|
|||||||||
|
Net investment gains
|
( |
)
|
( |
)
|
( |
)
|
||||||
|
Changes in Assets and Liabilities:
|
||||||||||||
|
Losses and loss expenses
|
( |
)
|
( |
)
|
|
|||||||
|
Unearned premiums
|
( |
)
|
|
|
||||||||
|
Accrued expenses
|
( |
)
|
( |
)
|
( |
)
|
||||||
|
Premiums receivable
|
|
( |
)
|
( |
)
|
|||||||
|
Deferred policy acquisition costs
|
|
|
( |
)
|
||||||||
|
Deferred income taxes
|
|
( |
)
|
|
||||||||
|
Reinsurance receivable
|
|
|
|
|||||||||
|
Accrued investment income
|
( |
)
|
( |
)
|
( |
)
|
||||||
|
Amounts due from affiliate
|
|
( |
)
|
( |
)
|
|||||||
|
Reinsurance balances payable
|
( |
)
|
( |
)
|
|
|||||||
|
Prepaid reinsurance premiums
|
|
( |
)
|
( |
)
|
|||||||
|
Current income taxes
|
( |
)
|
|
|
||||||||
|
Other, net
|
( |
)
|
|
|
||||||||
|
Net adjustments
|
( |
)
|
|
|
||||||||
|
Net cash provided by operating activities
|
|
|
|
|||||||||
|
Cash Flows from Investing Activities:
|
||||||||||||
|
Purchases of fixed maturities:
|
||||||||||||
|
Held to maturity
|
( |
)
|
( |
)
|
( |
)
|
||||||
|
Available for sale
|
( |
)
|
( |
)
|
( |
)
|
||||||
|
Purchases of equity securities
|
( |
)
|
( |
)
|
( |
)
|
||||||
|
Sales of fixed maturities:
|
||||||||||||
|
Available for sale
|
|
|
|
|||||||||
|
Maturity of fixed maturities:
|
||||||||||||
|
Held to maturity
|
|
|
|
|||||||||
|
Available for sale
|
|
|
|
|||||||||
|
Sales of equity securities
|
|
|
|
|||||||||
|
Net (purchases) sales of property and equipment
|
( |
)
|
|
( |
)
|
|||||||
|
Net (purchases) sales of short-term investments
|
( |
)
|
|
|
||||||||
|
Net cash used in investing activities
|
( |
)
|
( |
)
|
( |
)
|
||||||
|
Cash Flows from Financing Activities:
|
||||||||||||
|
Issuance of common stock
|
|
|
|
|||||||||
|
Cash dividends paid
|
( |
)
|
( |
)
|
( |
)
|
||||||
|
Net cash (used in) provided by financing activities
|
( |
)
|
|
( |
)
|
|||||||
|
Net (decrease) increase in cash
|
( |
)
|
|
( |
)
|
|||||||
|
Cash at beginning of year
|
|
|
|
|||||||||
|
Cash at end of year
|
$
|
|
$
|
|
$
|
|
||||||
See accompanying notes to consolidated financial statements.
Donegal Group Inc.
1 - Summary of Significant Accounting Policies
Organization and Business
Donegal Mutual Insurance Company (“Donegal Mutual”) organized us as an insurance holding company on August 26, 1986. Our insurance subsidiaries are Atlantic States Insurance Company (“Atlantic
States”), Michigan Insurance Company (“MICO”), the Peninsula Insurance Group (“Peninsula”), which consists of The Peninsula Insurance Company and its wholly owned subsidiary Peninsula Indemnity Company, and Southern Insurance Company of
Virginia (“Southern”). Our insurance subsidiaries and their affiliates write commercial and personal lines of property and casualty coverages exclusively through a network of independent insurance agents in certain Mid-Atlantic, Midwestern,
Southern and Southwestern states.
At December 31, 2025, we had three segments: our investment function, our commercial lines of insurance and our personal lines of insurance. The commercial lines products of our insurance subsidiaries consist primarily of commercial automobile, commercial multi-peril and workers’ compensation policies. The personal lines products of our insurance subsidiaries consist primarily of homeowners and private passenger automobile policies.
At December 31, 2025, Donegal Mutual held approximately 44 % of our outstanding Class A common stock and approximately 85 % of our outstanding Class B common stock. This ownership provides Donegal Mutual with approximately 70 % of the total voting power of our common stock. Our insurance subsidiaries and Donegal Mutual have interrelated operations due to a pooling agreement and other intercompany agreements and transactions. While each company maintains its separate corporate existence, our insurance subsidiaries and Donegal Mutual conduct business together as the Donegal Insurance Group. As such, Donegal Mutual and our insurance subsidiaries share the same business philosophy, the same management, the same employees and the same facilities and offer the same types of insurance products.
Atlantic States, our largest subsidiary, participates in a proportional reinsurance agreement (the “pooling agreement”) with Donegal Mutual. Under the pooling agreement, Donegal Mutual and Atlantic States contribute substantially all of their respective premiums, losses and loss expenses to the underwriting pool, and the underwriting pool, acting through Donegal Mutual, then allocates 80 % of the pooled business to Atlantic States. Thus, Donegal Mutual and Atlantic States share the underwriting results of the pooled business in proportion to their respective participation in the underwriting pool.
In addition, Donegal Mutual has a 100 % quota-share reinsurance agreement with Southern Mutual Insurance Company (“Southern Mutual”). Donegal Mutual places its assumed business from Southern Mutual into the underwriting pool. Donegal Mutual also has a 100 % quota-share reinsurance agreement with Mountain States Indemnity Company and Mountain States Commercial Insurance Company (collectively, the “Mountain States insurance subsidiaries”). Donegal Mutual places its assumed business from the Mountain States insurance subsidiaries into the underwriting pool.
The same executive management and underwriting personnel administer products, classes of business underwritten, pricing practices and underwriting standards of Donegal Mutual and our insurance subsidiaries. In
addition, as the Donegal Insurance Group, Donegal Mutual and our insurance subsidiaries share a combined business plan to achieve market penetration and underwriting profitability objectives. The products our insurance subsidiaries and Donegal
Mutual market are generally complementary, thereby allowing the Donegal Insurance Group to offer a broader range of products to a given market and to expand the Donegal Insurance Group’s ability to service an entire personal lines or commercial
lines account. Distinctions within the products of Donegal Mutual and our insurance subsidiaries generally allow the individual companies to manage certain risk segments through variations in coverage, terms and pricing. Therefore, the
underwriting profitability of the business the individual companies write directly will vary. However, the underwriting pool homogenizes the risk characteristics of all business that Donegal Mutual and Atlantic States write directly. The
business Atlantic States derives from the underwriting pool represents a significant percentage of our total consolidated revenues. We refer to Note 3 - Transactions with Affiliates for more information regarding the pooling agreement.
In September 2025, Donegal Mutual and Southern entered into a renewal rights agreement with an affiliate of a farm-focused Pennsylvania-based mutual insurance group to provide a continuation option for their farm policyholders when they begin to non-renew all farm policies as they expire beginning in the second quarter of 2026. Donegal Mutual and Southern determined that the costs required to modernize the legacy farm product and systems were higher than the projected return on investment for this non-core line of business that represents approximately $6 million in premiums. None of our other insurance subsidiaries offered farm policies. We currently include farm policies within other commercial lines in our line of business reporting.
Basis of Consolidation
Our consolidated financial statements, which we have prepared in accordance with accounting principles generally accepted in the United States of America (“GAAP”), include our accounts and those of our wholly owned
subsidiaries. We have eliminated all significant inter-company accounts and transactions in consolidation. The terms “we,” “us,” “our” or the “Company” as we use them in the notes to our consolidated financial statements refer to the
consolidated entity.
Use of Estimates
In preparing our consolidated financial statements, our management makes estimates and assumptions that affect the reported amounts of assets and liabilities at the date of the balance sheet and revenues and
expenses for the period then ended. Actual results could differ significantly from those estimates.
We make estimates and assumptions that could have a significant effect on amounts and disclosures we report in our consolidated financial statements. The most significant estimates relate to our insurance
subsidiaries’ reserves for property and casualty insurance unpaid losses and loss expenses. While we believe our estimates and the estimates of our insurance subsidiaries are appropriate, the ultimate amounts may differ from the estimates
provided. We regularly review our methods for making these estimates as well as the continuing appropriateness of the estimated amounts, and we reflect any adjustment we consider necessary in our current results of operations.
Reclassification
We have made certain reclassifications in our prior period financial statements to conform to the current year presentation.
Investments
We classify our debt securities into the following categories:
Held to Maturity - Debt securities that we have the positive intent and ability to hold to maturity; reported at amortized cost.
Available for Sale - Debt securities not classified as held to maturity; reported at fair value, with unrealized gains and losses excluded from income and reported as a separate component of stockholders’ equity
(net of tax effects).
Short-term investments are carried at amortized cost, which approximates fair value.
We make estimates concerning the valuation of our investments and, as applicable, the recognition of declines in the value of our investments. For equity securities, we measure investments at fair value, and we
recognize changes in fair value in our results of operations. With respect to an available-for-sale debt security that is in an unrealized loss position, we first assess if we intend to sell the debt security. If we determine we intend to sell
the debt security, we recognize the impairment loss in our results of operations. If we do not intend to sell the debt security, we determine whether it is more likely than not that we will be required to sell the debt security prior to
recovery. If we determine it is more likely than not that we will be required to sell the debt security prior to recovery, we recognize the impairment loss in our results of operations. If we determine it is more likely than not that we will
not be required to sell the debt security prior to recovery, we then evaluate whether a credit loss has occurred with respect to that security. We determine whether a credit loss has occurred by comparing the amortized cost of the debt security
to the present value of the cash flows we expect to collect. If we expect a cash flow shortfall, we consider that a credit loss has occurred. If we determine that a credit loss has occurred, we establish an allowance for credit loss. We then
recognize the amount of the allowance in our results of operations, and we recognize the remaining portion of the impairment loss in our other comprehensive income, net of applicable taxes. We regularly review the allowance for credit losses
and recognize changes in the allowance in our results of operations. In addition, we may write down securities in an unrealized loss position based on a number of other factors, including when the fair value of an investment is significantly
below its cost, when the financial condition of the issuer of a security has deteriorated, the occurrence of industry, issuer or geographic events that have negatively impacted the value of a security and rating agency downgrades. For
held-to-maturity debt securities, we make estimates concerning expected credit losses at an aggregated level rather than monitoring individual debt securities for credit losses. We establish an allowance for expected credit losses based on an
ongoing review of securities held, historical loss data, changes in issuer credit standing and other relevant factors. We utilize a probability-of-default methodology, which reflects current and forecasted economic conditions, to estimate the
allowance for expected credit losses and recognize changes to the allowance in our results of operations.
We amortize premiums and discounts on debt securities over the life of the security as an adjustment to yield using the effective interest method. We compute investment gains and losses using the specific
identification method.
We amortize premiums and discounts for mortgage-backed debt securities using anticipated prepayments.
Fair Values of Financial Instruments
We use the following methods and assumptions in estimating our fair value disclosures:
Investments - We present our investments in available-for-sale fixed maturity and equity securities at estimated fair value. The estimated fair value of a security may differ from the amount that we could realize
if we sold the security in a forced transaction. In addition, the valuation of fixed maturity investments is more subjective when markets are less liquid, increasing the potential that the estimated fair value does not reflect the price at
which an actual transaction would occur. We utilize nationally recognized independent pricing services to estimate fair values for our fixed maturity and equity investments. We generally obtain two prices per security. The pricing services
utilize market quotations for fixed maturity and equity securities that have quoted prices in active markets. For fixed maturity securities that generally do not trade on a daily basis, the pricing services prepare estimates of fair value
measurements based predominantly on observable market inputs. The pricing services do not use broker quotes in determining the fair values of our investments. Our investment personnel review the estimates of fair value the pricing services
provide to determine if the estimates we obtain are representative of fair values based upon the general knowledge of our investment personnel of the market, their research findings related to unusual fluctuations in value and their comparison
of such values to execution prices for similar securities. Our investment personnel monitor the market and are familiar with current trading ranges for similar securities and the pricing of specific investments. Our investment personnel review
all pricing estimates that we receive from the pricing services against their expectations with respect to pricing based on fair market curves, security ratings, coupon rates, security type and recent trading activity. Our investment personnel
review documentation with respect to the pricing services’ pricing methodology that they obtain periodically to determine if the primary pricing sources, market inputs and pricing frequency for various security types are reasonable. We refer to
Note 5 - Fair Value Measurements for more information regarding our methods and assumptions in estimating fair values.
Cash and Short-Term Investments - The carrying amounts we report in the balance sheet for these instruments approximate their fair values.
Premiums and Reinsurance Receivables and Payables - The carrying amounts we report in the balance sheet for these instruments related to premiums and paid losses and loss expenses approximate their fair values.
Revenue Recognition
Our insurance subsidiaries recognize insurance premiums as income over the terms of the policies they issue. Our insurance subsidiaries calculate unearned premiums on a daily pro-rata basis.
Policy Acquisition Costs
We defer our insurance subsidiaries’ policy acquisition costs, consisting primarily of commissions, premium taxes and certain other underwriting costs, reduced by ceding commissions, related directly to the
successful acquisition of new or renewal insurance contracts. We amortize these deferred policy acquisition costs over the period in which our insurance subsidiaries earn the premiums. The method we follow in computing deferred policy
acquisition costs limits the amount of such deferred costs to their estimated realizable value, which gives effect to the premium to be earned, related investment income, losses and loss expenses and certain other costs we expect to incur as
our insurance subsidiaries earn the premium. Estimates in the calculation of policy acquisition costs have not shown material variability because of uncertainties in applying accounting principles or as a result of sensitivities to changes in
key assumptions.
Property and Equipment
We report property and equipment at depreciated cost that we compute using the straight-line method based upon estimated useful lives of the assets.
Losses and Loss Expenses
Liabilities for losses and loss expenses are estimates at a given point in time of the amounts an insurer expects to pay with respect to incurred policyholder claims based on facts and circumstances the insurer
knows at that point in time. For example, legislative, judicial and regulatory actions may expand coverage definitions, retroactively mandate coverage or otherwise require our insurance subsidiaries to pay losses for damages that their policies
explicitly excluded or did not intend to cover. At the time of establishing its estimates, an insurer recognizes that its ultimate liability for losses and loss expenses will exceed or be less than such estimates. Our insurance subsidiaries
base their estimates of liabilities for losses and loss expenses on assumptions as to future loss trends, expected claims severity, judicial theories of liability and other factors. However, during the loss adjustment period, our insurance
subsidiaries may learn additional facts regarding individual claims, and, consequently, it often becomes necessary for our insurance subsidiaries to refine and adjust their estimates for these liabilities. We reflect any adjustments to the
liabilities for losses and loss expenses of our insurance subsidiaries in our consolidated results of operations in the period in which our insurance subsidiaries make adjustments to their estimates.
Our insurance subsidiaries maintain liabilities for the payment of losses and loss expenses with respect to both reported and unreported claims. Our insurance subsidiaries establish these liabilities for the
purpose of covering the ultimate costs of settling all losses, including investigation and litigation costs. Our insurance subsidiaries base the amount of their liability for reported losses primarily upon a case-by-case evaluation of the type
of risk involved, knowledge of the circumstances surrounding each claim and the insurance policy provisions relating to the type of loss the policyholder incurred. Our insurance subsidiaries determine the amount of their liability for
unreported claims and loss expenses on the basis of historical information by line of insurance. Our insurance subsidiaries account for inflation in the reserving function through analysis of costs and trends and reviews of historical reserving
results. Our insurance subsidiaries monitor their liabilities closely and recompute them periodically using new information on reported claims and a variety of statistical techniques. Our insurance subsidiaries do not discount their liabilities
for losses and loss expenses.
Reserve estimates can change over time because of unexpected changes in assumptions related to our insurance subsidiaries’ external environment and, to a lesser extent, assumptions related to our insurance
subsidiaries’ internal operations. For example, our insurance subsidiaries have experienced an increase in claims severity and a lengthening of the claim settlement periods on bodily injury claims during the past several years. In addition, the
COVID-19 pandemic and related government mandates and restrictions resulted in various changes from historical claims reporting and settlement trends during 2020 and resulted in significant increases in loss costs in subsequent years due to a
number of factors, including supply chain disruption, higher new and used automobile values, increases in the cost of replacement automobile parts and rising labor rates. These trend changes caused significant disruption to historical loss
patterns and give rise to greater uncertainty as to the pattern of future loss settlements. Related uncertainties regarding future trends include social inflation, availability and cost of replacement automobile parts and building materials,
availability and cost of skilled labor, the rate of specialized plaintiff attorney involvement in claims, increasing plaintiff attorney utilization of litigation financing and its impact on litigation strategies and the cost of medical
technologies and procedures. Assumptions related to our insurance subsidiaries’ external environment include the absence of significant changes in tort law and the legal environment that increase liability exposure, consistency in judicial
interpretations of insurance coverage and policy provisions and the rate of loss cost inflation. Internal assumptions include consistency in the recording of premium and loss statistics, consistency in the recording of claims, payment and case
reserving methodology, accurate measurement of the impact of rate changes and changes in policy provisions, consistency in the quality and characteristics of business written within a given line of business and consistency in reinsurance
coverage and collectability of reinsured losses, among other items. To the extent our insurance subsidiaries determine that underlying factors impacting their assumptions have changed, our insurance subsidiaries make adjustments in their
reserves that they consider appropriate for such changes. Accordingly, our insurance subsidiaries’ ultimate liability for unpaid losses and loss expenses will likely differ from the amount recorded at December 31, 2025.
Our insurance subsidiaries seek to enhance their underwriting results by carefully selecting the product lines they underwrite. Our insurance subsidiaries’ personal lines products primarily include standard and
preferred risks in private passenger automobile and homeowners lines. Our insurance subsidiaries’ commercial lines products primarily include business offices, wholesalers, service providers, contractors, artisans and light manufacturing
operations. Our insurance subsidiaries have limited exposure to asbestos and other environmental liabilities.
Income Taxes
We currently file a consolidated federal income tax return that includes us and our insurance subsidiaries.
We account for income taxes using the asset and liability method. The objective of the asset and liability method is to establish deferred tax assets and liabilities for the temporary differences between the
financial reporting basis and the tax basis of our assets and liabilities at enacted tax rates we expect to be in effect when we realize or settle such amounts.
Credit Risk
Our objective is to earn competitive returns by investing in a diversified portfolio of securities. Our portfolio of fixed maturity securities and, to a lesser extent, short-term investments is subject to credit
risk. We define this risk as the potential loss in fair value resulting from adverse changes in the borrower’s ability to repay its debt to us. We manage this risk by performing an analysis of prospective investments and through regular reviews
of our portfolio by our investment personnel. We also limit the amount of our total investment portfolio that we invest in any one security.
Our insurance subsidiaries provide property and liability insurance coverages through independent insurance agencies located throughout their operating areas. Our insurance subsidiaries bill the majority of this
business directly to their policyholders, although our insurance subsidiaries bill a portion of their commercial business through their agents, to whom they extend credit in the normal course of business.
Our insurance subsidiaries have reinsurance agreements with Donegal Mutual and with a number of major unaffiliated reinsurers.
Reinsurance Accounting and Reporting
Our insurance subsidiaries rely upon reinsurance agreements to limit their maximum net loss from large single risks or risks in concentrated areas and to increase their capacity to write insurance. Reinsurance does
not relieve our insurance subsidiaries from liability to their respective policyholders. To the extent that a reinsurer cannot pay losses for which it is liable under the terms of a reinsurance agreement with one or more of our insurance
subsidiaries, our insurance subsidiaries retain continued liability for such losses. However, in an effort to reduce the risk of non-payment, our insurance subsidiaries require all of their reinsurers to have an A.M. Best rating of A- or better
or, with respect to foreign reinsurers, to have a financial condition that, in the opinion of our management, is equivalent to a company with an A.M. Best rating of A- or better. We refer to Note 10 - Reinsurance for more information regarding
the reinsurance agreements of our insurance subsidiaries.
We report reinsurance receivable net of an allowance for expected credit losses. We establish an allowance for expected credit losses based upon our ongoing review of amounts outstanding, historical loss data,
changes in reinsurer credit standing and other relevant factors. We utilize a probability-of-default methodology, which reflects current and forecasted economic conditions, to estimate the allowance for expected credit losses and recognize
changes to the allowance in our results of operations.
Stock-Based Compensation
We measure all share-based payments to our directors and the directors and employees of our subsidiaries and affiliates, including grants of stock options, using a fair-value-based method and record such expense in
our results of operations. In determining the expense we record for stock options we grant to our directors and the directors and employees of our subsidiaries and affiliates, we estimate the fair value of each option award on the date of grant
using the Black-Scholes option pricing model. The significant assumptions we utilize in applying the Black-Scholes option pricing model are the risk-free interest rate, expected term, dividend yield and expected volatility.
In 2025, 2024 and 2023, we realized $1,271,177 , $370,644 and $139,135 , respectively, in tax benefits upon the exercise of stock options.
Earnings Per Share
We calculate basic earnings per share by dividing net income by the weighted-average number of common shares outstanding for the period. Diluted earnings per share reflects the dilution that could occur if
securities or other contracts to issue common stock were exercised or converted into common stock.
We have two classes of common stock, which we refer to as Class A common stock and Class B common stock. Our Class A common stock is entitled to the declaration and payment of cash dividends that are at least 10 % higher than those we declare and pay on our Class B common stock. Accordingly, we use the two-class method for the computation of earnings per common share. The two-class method is an earnings allocation formula that determines earnings per share separately for each class of common stock based on dividends declared and an allocation of remaining undistributed earnings using a participation percentage that reflects the dividend rights of each class.
Goodwill and Other Intangible Assets
Goodwill represents the excess of the purchase price over the underlying fair value of acquired entities. When completing acquisitions, we seek also to identify separately identifiable intangible assets that we
have acquired. We assess goodwill and intangible assets with an indefinite useful life for impairment annually. We also assess goodwill and other intangible assets for impairment upon the occurrence of certain events. In making our assessment,
we consider a number of factors including operating results, business plans, economic projections, anticipated future cash flows and current market data. Inherent uncertainties exist with respect to these factors and to our judgment in applying
them when we make our assessment. Impairment of goodwill and other intangible assets could result from changes in economic and operating conditions in future periods.
2 - Impact of New Accounting Standards
In September 2016, the Financial Accounting Standards Board (the “FASB”) issued guidance that amended previous guidance on the impairment of financial instruments by adding an impairment model that requires an entity to recognize expected credit losses as an allowance rather than impairments as credit losses are incurred. The intent of this guidance is to reduce complexity and result in a more timely recognition of expected credit losses. In November 2019, the FASB issued guidance that delayed the effective date for “smaller reporting companies,” as defined in Item 10(f)(1) of Regulation S-K, to annual and interim reporting periods beginning after December 15, 2022 from December 15, 2019. We were a smaller reporting company at the time this guidance was issued, and our adoption of this guidance on January 1, 2023 resulted in an after-tax decrease in retained earnings of $1.9 million. The adoption of this guidance did not have a significant impact on our results of operations or cash flows.
In November 2023, the FASB issued guidance that amended previous guidance on the disclosure of reportable segments. The guidance requires disclosure of incremental segment information including the title and
position of the individual identified as the chief operating decision maker, a narrative explanation of how the chief operating decision maker uses each reported measure of a segment’s profit or loss in assessing performance and determining how
to allocate resources, as well as quantification of significant segment expenses and other items. We refer to Note 18 - Segment Information for further information and disclosure of items required within the amended and enhanced guidance. The
adoption of this guidance did not have an impact on our financial position, results of operations or cash flows.
In December 2023, the FASB issued guidance to enhance the transparency and usefulness of income tax disclosures. The guidance requires disclosure of specific categories in the rate reconciliation table and
additional information for reconciling items that meet a quantitative threshold of equal to or greater than 5 percent of the amount computed by multiplying pretax income or loss by the applicable statutory income tax rate. The guidance also
requires disaggregated disclosure of the amount of income taxes paid for federal, state and foreign taxes. We refer to Note 11- Income Taxes for further information and disclosure of items required within the amended and enhanced guidance. The
adoption of this guidance did not have an impact on our financial position, results of operations or cash flows.
In November 2024, the FASB issued guidance requiring disaggregated disclosure of income statement expenses in the notes to financial statements. The guidance requires disclosure of certain expenses, including
employee compensation, depreciation and selling expenses. The guidance will not impact current income statement expense captions that industry-specific guidance requires. The guidance is effective for annual reporting periods beginning after
December 15, 2026. The adoption of this guidance will not have an impact on our financial position, results of operations or cash flows.
3 - Transactions with Affiliates
Our insurance subsidiaries conduct business and have various agreements with Donegal Mutual that we describe in the following subparagraphs:
a. Reinsurance Pooling and Other Reinsurance Arrangements
Atlantic States, our largest insurance subsidiary, and Donegal Mutual have a pooling agreement under which both companies contribute substantially all of their direct written business to the pool and receive an allocated percentage of the pooled underwriting results, excluding certain reinsurance Donegal Mutual assumes from our insurance subsidiaries. In addition, Donegal Mutual has 100 % quota-share reinsurance agreements with Southern Mutual and the Mountain States insurance subsidiaries, and Donegal Mutual places the business of Southern Mutual and the Mountain States insurance subsidiaries into the underwriting pool. Atlantic States has an 80 % share of the results of the pool, and Donegal Mutual has a 20 % share of the results of the pool. The intent of the pooling agreement is to produce more uniform and stable underwriting results from year to year for each pool participant than they would experience individually and to spread the risk of loss between the participants based on each participant’s relative amount of surplus and relative access to capital. Each participant in the pool has at its disposal the capacity of the entire pool, rather than being limited to policy exposures of a size commensurate with its own capital and surplus.
The following amounts represent reinsurance Atlantic States ceded to the pool during 2025, 2024 and 2023:
|
2025
|
2024
|
2023
|
||||||||||
|
Premiums earned
|
$
|
|
$
|
|
$
|
|
||||||
|
Losses and loss expenses
|
|
|
|
|||||||||
|
Prepaid reinsurance premiums
|
|
|
|
|||||||||
|
Liability for losses and loss expenses
|
|
|
|
|||||||||
The following amounts represent reinsurance Atlantic States assumed from the pool during 2025, 2024 and 2023:
|
2025
|
2024
|
2023
|
||||||||||
|
Premiums earned
|
$
|
|
$
|
|
$
|
|
||||||
|
Losses and loss expenses
|
|
|
|
|||||||||
|
Unearned premiums
|
|
|
|
|||||||||
|
Liability for losses and loss expenses
|
|
|
|
|||||||||
Donegal Mutual and MICO had a quota-share reinsurance agreement under which Donegal Mutual assumed 25 % of the premiums and losses related to the business of MICO for policies effective through December 31, 2021. Donegal Mutual and MICO terminated this reinsurance agreement on a run-off basis effective January 1, 2022. Donegal Mutual and Peninsula had a quota-share reinsurance agreement under which Donegal Mutual assumed 100 % of the premiums and losses related to the workers’ compensation product line of Peninsula in certain states for policies effective through December 31, 2021. Donegal Mutual and Peninsula terminated this reinsurance agreement on a run-off basis effective January 1, 2022. Donegal Mutual places its assumed business from MICO and Peninsula into the underwriting pool.
The following amounts represent reinsurance ceded to Donegal Mutual pursuant to these quota-share reinsurance agreements during 2025, 2024 and 2023:
|
2025
|
2024
|
2023
|
||||||||||
|
Premiums earned
|
$
|
( |
)
|
$
|
|
$
|
|
|||||
|
Losses and loss expenses
|
|
( |
)
|
|
||||||||
|
Liability for losses and loss expenses
|
|
|
|
|||||||||
In 2025, 2024, and 2023, each of our insurance subsidiaries had a catastrophe reinsurance agreement with Donegal Mutual that provided coverage under any one catastrophic occurrence above a set retention of $3,000,000 6,000,000 3,000,000
The following amounts represent reinsurance that our insurance subsidiaries ceded to Donegal Mutual pursuant to these reinsurance agreements during 2025, 2024 and 2023:
|
2025
|
2024
|
2023
|
||||||||||
|
Premiums earned
|
$
|
|
$
|
|
$
|
|
||||||
|
Losses and loss expenses
|
|
|
|
|||||||||
|
Liability for losses and loss expenses
|
|
|
|
|||||||||
The following amounts represent the effect of affiliated reinsurance transactions on net premiums our insurance subsidiaries earned during 2025, 2024 and 2023:
|
2025
|
2024
|
2023
|
||||||||||
|
Assumed
|
$
|
|
$
|
|
$
|
|
||||||
|
Ceded
|
( |
)
|
( |
)
|
( |
)
|
||||||
|
Net
|
$
|
|
$
|
|
$
|
|
||||||
The following amounts represent the effect of affiliated reinsurance transactions on net losses and loss expenses our insurance subsidiaries incurred during 2025, 2024 and 2023:
|
2025
|
2024
|
2023
|
||||||||||
|
Assumed
|
$
|
|
$
|
|
$
|
|
||||||
|
Ceded
|
( |
)
|
( |
)
|
( |
)
|
||||||
|
Net
|
$
|
|
$
|
|
$
|
|
||||||
b. Expense Sharing
Donegal Mutual provides facilities, management and other services to us and our insurance subsidiaries. In addition, Donegal Mutual purchases and maintains the information technology systems that support the business of Donegal Mutual and our insurance subsidiaries. Donegal Mutual allocates certain related expenses to Atlantic States in relation to the relative participation of Atlantic States and Donegal Mutual in the pooling agreement. Our insurance subsidiaries other than Atlantic States reimburse Donegal Mutual for allocated costs of services Donegal Mutual provides on their behalf based on their proportion of the total direct premiums written of the Donegal Insurance Group and other metrics. Donegal Mutual allocates costs related to its development and maintenance of information technology systems over the estimated useful life of those systems (generally five years) and charges a proportionate share of those costs to our insurance subsidiaries based on their percentage of the total net premiums written of the Donegal Insurance Group. Allocated expenses from Donegal Mutual for services it provided to our insurance subsidiaries totaled $224,811,543 , $224,565,390 and $218,974,132 for 2025, 2024 and 2023, respectively.
Donegal Mutual completed all major development activities related to the multi-year effort to modernize certain of its key technology infrastructure and application systems. Donegal Mutual placed several releases of new systems into service beginning in 2020 and ending with the two final releases in 2025. Donegal Mutual allocated $11.3 million, $12.3 million and $10.5 million of related costs to our insurance subsidiaries in 2025, 2024 and 2023, respectively. Donegal Mutual will allocate to our insurance subsidiaries their proportionate share of the remaining $45.6 million of related costs over the next five years.
Our management believes that the allocation methods Donegal Mutual utilizes are reasonable. In addition, Donegal Mutual and we maintain a coordinating committee that consists of two members of our board of
directors, neither of whom is a member of Donegal Mutual’s board of directors, and two members of Donegal Mutual’s board of directors, neither of whom is a member of our board of directors. The purpose of the coordinating committee is to
maintain a process for an ongoing evaluation of the fairness of the terms of all transactions between Donegal Mutual and our insurance subsidiaries.
c. Lease Agreement
We lease office equipment with terms ranging from 3 to 10 years to Donegal Mutual under a lease agreement effective January 1, 2020.
4 - Investments
The amortized cost and estimated fair values of our fixed maturities at December 31, 2025 and 2024 are as follows:
|
2025
|
||||||||||||||||||||||||
|
Carrying Value
|
Allowance for
Credit Losses
|
Amortized
Cost
|
Gross
Unrealized
Gains
|
Gross
Unrealized
Losses
|
Estimated Fair
Value
|
|||||||||||||||||||
|
Held to Maturity
|
||||||||||||||||||||||||
|
U.S. Treasury securities and obligations of U.S. government corporations and agencies
|
$
|
|
$
|
|
$
|
|
$
|
|
$
|
|
$
|
|
||||||||||||
|
Obligations of states and political subdivisions
|
|
|
|
|
|
|
||||||||||||||||||
|
Corporate securities
|
|
|
|
|
|
|
||||||||||||||||||
|
Mortgage-backed securities
|
|
|
|
|
|
|
||||||||||||||||||
|
Totals
|
$
|
|
$
|
|
$
|
|
$
|
|
$
|
|
$
|
|
||||||||||||
|
2025
|
||||||||||||||||
|
Available for Sale
|
Amortized Cost
|
Gross Unrealized
Gains
|
Gross Unrealized
Losses
|
Estimated Fair
Value
|
||||||||||||
|
U.S. Treasury securities and obligations of U.S. government corporations and agencies
|
$
|
|
$
|
|
$
|
|
$
|
|
||||||||
|
Obligations of states and political subdivisions
|
|
|
|
|
||||||||||||
|
Corporate securities
|
|
|
|
|
||||||||||||
|
Mortgage-backed securities
|
|
|
|
|
||||||||||||
|
Totals
|
$
|
|
$
|
|
$
|
|
$
|
|
||||||||
|
2024
|
||||||||||||||||||||||||
|
Carrying Value
|
Allowance for
Credit Losses
|
Amortized
Cost
|
Gross
Unrealized
Gains
|
Gross
Unrealized
Losses
|
Estimated Fair
Value
|
|||||||||||||||||||
|
Held to Maturity
|
||||||||||||||||||||||||
|
U.S. Treasury securities and obligations of U.S. government corporations and agencies
|
$
|
|
$
|
|
$
|
|
$
|
|
$
|
|
$
|
|
||||||||||||
|
Obligations of states and political subdivisions
|
|
|
|
|
|
|
||||||||||||||||||
|
Corporate securities
|
|
|
|
|
|
|
||||||||||||||||||
|
Mortgage-backed securities
|
|
|
|
|
|
|
||||||||||||||||||
|
Totals
|
$
|
|
$
|
|
$
|
|
$
|
|
$
|
|
$
|
|
||||||||||||
|
2024
|
||||||||||||||||
|
Available for Sale
|
Amortized Cost
|
Gross Unrealized
Gains
|
Gross Unrealized
Losses
|
Estimated Fair
Value
|
||||||||||||
|
U.S. Treasury securities and obligations of U.S. government corporations and agencies
|
$
|
|
$
|
|
$
|
|
$
|
|
||||||||
|
Obligations of states and political subdivisions
|
|
|
|
|
||||||||||||
|
Corporate securities
|
|
|
|
|
||||||||||||
|
Mortgage-backed securities
|
|
|
|
|
||||||||||||
|
Totals
|
$
|
|
$
|
|
$
|
|
$
|
|
||||||||
At December 31, 2025, our holdings of obligations of states and political subdivisions included general obligation bonds with an aggregate fair value of $291.7 million and an amortized cost of $317.5 million. Our holdings also included special revenue bonds with an aggregate fair value of $158.0 million and an amortized cost of $169.6 million. With respect to both categories of bonds, we held no securities of any issuer that comprised more than 10 % of that category at December 31, 2025. Education bonds and water and sewer utility bonds represented 42 % and 32 %, respectively, of our total investments in special revenue bonds based on their carrying values at December 31, 2025. Many of the issuers of the special revenue bonds we held at December 31, 2025 have the authority to impose ad valorem taxes. In that respect, many of the special revenue bonds we held are similar to general obligation bonds.
At December 31, 2024, our holdings of obligations of states and political subdivisions included general obligation bonds with an aggregate fair value of $233.1 million and an amortized cost of $272.5 million. Our holdings also included special revenue bonds with an aggregate fair value of $123.0 million and an amortized cost of $141.3 million. With respect to both categories of bonds, we held no securities of any issuer that comprised more than 10 % of that category at December 31, 2024. Education bonds and water and sewer utility bonds represented 44 % and 37 %, respectively, of our total investments in special revenue bonds based on their carrying values at December 31, 2024. Many of the issuers of the special revenue bonds we held at December 31, 2024 have the authority to impose ad valorem taxes. In that respect, many of the special revenue bonds we held are similar to general obligation bonds.
We have segregated within accumulated other comprehensive loss the net unrealized losses of $15.1 million arising prior to the November 30, 2013 reclassification date for fixed maturities reclassified from available for sale to held to maturity. We are amortizing this balance over the remaining life of the related securities as an adjustment of yield in a manner consistent with the accretion of discount on the same fixed maturities. We recorded amortization of $181,869 , $219,583 and $284,095 in other comprehensive income in 2025, 2024 and 2023, respectively. At December 31, 2025 and 2024, net unrealized losses of $853,706 and $1.0 million, respectively, remained within accumulated other comprehensive loss.
We set forth below the amortized cost and estimated fair value of fixed maturities at December 31, 2025 by contractual maturity. Expected maturities may differ from contractual maturities because borrowers may have the right to call or prepay obligations with or without call or prepayment penalties.
|
Amortized Cost
|
Estimated Fair
Value
|
|||||||
|
Held to maturity
|
||||||||
|
Due in one year or less
|
$
|
|
$
|
|
||||
|
Due after one year through five years
|
|
|
||||||
|
Due after five years through ten years
|
|
|
||||||
|
Due after ten years
|
|
|
||||||
|
Mortgage-backed securities
|
|
|
||||||
|
Total held to maturity
|
$
|
|
$
|
|
||||
|
Available for sale
|
||||||||
|
Due in one year or less
|
$
|
|
$
|
|
||||
|
Due after one year through five years
|
|
|
||||||
|
Due after five years through ten years
|
|
|
||||||
|
Due after ten years
|
|
|
||||||
|
Mortgage-backed securities
|
|
|
||||||
|
Total available for sale
|
$
|
|
$
|
|
||||
The cost and estimated fair values of our equity securities at December 31, 2025 were as follows:
|
Cost
|
Gross Gains
|
Gross Losses
|
Estimated Fair
Value
|
|||||||||||||
|
Equity securities
|
$
|
|
$
|
|
$
|
|
$
|
|
||||||||
The cost and estimated fair values of our equity securities at December 31, 2024 were as follows:
|
Cost
|
Gross Gains
|
Gross Losses
|
Estimated Fair
Value
|
|||||||||||||
|
Equity securities
|
$
|
|
$
|
|
$
|
|
$
|
|
||||||||
The amortized cost of fixed maturities on deposit with various regulatory authorities at December 31, 2025 and 2024 amounted to $10,316,907 and $10,323,629 , respectively.
We derived net investment income, consisting primarily of interest and dividends, from the following sources:
|
2025
|
2024
|
2023
|
||||||||||
|
Fixed maturities
|
$
|
|
$
|
|
$
|
|
||||||
|
Equity securities
|
|
|
|
|||||||||
|
Short-term investments
|
|
|
|
|||||||||
|
Other
|
|
|
|
|||||||||
|
Investment income
|
|
|
|
|||||||||
|
Investment expenses
|
( |
)
|
( |
)
|
( |
)
|
||||||
|
Net investment income
|
$
|
|
$
|
|
$
|
|
||||||
We present below gross gains and losses from investments and the change in the difference between fair value and cost of investments:
|
2025
|
2024
|
2023
|
||||||||||
|
Gross realized gains:
|
||||||||||||
|
Fixed maturities
|
$
|
|
$
|
|
$
|
|
||||||
|
Equity securities
|
|
|
|
|||||||||
| |
|
|
||||||||||
|
Gross realized losses:
|
||||||||||||
|
Fixed maturities
|
|
|
|
|||||||||
|
Equity securities
|
|
|
|
|||||||||
| |
|
|
||||||||||
|
Net realized (losses) gains
|
( |
)
|
|
( |
)
|
|||||||
|
Gross unrealized gains on equity securities
|
|
|
|
|||||||||
|
Gross unrealized losses on equity securities
|
( |
)
|
( |
)
|
( |
)
|
||||||
|
Decrease (increase) in allowance for credit losses
|
|
( |
)
|
( |
)
|
|||||||
|
Net investment gains
|
$
|
|
$
|
|
$
|
|
||||||
|
Change in difference between fair value and cost of investments:
|
||||||||||||
|
Fixed maturities
|
$
|
|
$
|
( |
)
|
$
|
|
|||||
|
Equity securities
|
|
|
|
|||||||||
|
Totals
|
$
|
|
$
|
|
$
|
|
||||||
We held fixed maturities with unrealized losses representing declines that we considered temporary at December 31, 2025 as follows:
|
Less than 12 months
|
12 months or longer
|
|||||||||||||||
|
Fair Value
|
Unrealized
Losses
|
Fair Value
|
Unrealized
Losses
|
|||||||||||||
|
U.S. Treasury securities and obligations of U.S. government corporations and agencies
|
$
|
|
$
|
|
$
|
|
$
|
|
||||||||
|
Obligations of states and political subdivisions
|
|
|
|
|
||||||||||||
|
Corporate securities
|
|
|
|
|
||||||||||||
|
Mortgage-backed securities
|
|
|
|
|
||||||||||||
|
Totals
|
$
|
|
$
|
|
$
|
|
$
|
|
||||||||
We held fixed maturities with unrealized losses representing declines that we considered temporary at December 31, 2024 as follows:
|
Less than 12 months
|
12 months or longer
|
|||||||||||||||
|
Fair Value
|
Unrealized
Losses
|
Fair Value
|
Unrealized
Losses
|
|||||||||||||
|
U.S. Treasury securities and obligations of U.S. government corporations and agencies
|
$
|
|
$
|
|
$
|
|
$
|
|
||||||||
|
Obligations of states and political subdivisions
|
|
|
|
|
||||||||||||
|
Corporate securities
|
|
|
|
|
||||||||||||
|
Mortgage-backed securities
|
|
|
|
|
||||||||||||
|
Totals
|
$
|
|
$
|
|
$
|
|
$
|
|
||||||||
We held 638 debt securities that were in an unrealized loss position at December 31, 2025. Based upon our analysis of general market conditions and underlying factors impacting these debt securities, we considered these declines in value to be temporary.
We did no no no
5 - Fair Value Measurements
We account for financial assets using a framework that establishes a hierarchy that ranks the quality and reliability of inputs, or assumptions, used in the determination of fair value, and we classify financial
assets and liabilities carried at fair value in one of the following three categories:
Level 1 - quoted prices in active markets for identical assets and liabilities;
Level 2 - directly or indirectly observable inputs other than Level 1 quoted prices; and
Level 3 - unobservable inputs not corroborated by market data.
For investments that have quoted market prices in active markets, we use the quoted market price as fair value and include these investments in Level 1 of the fair value hierarchy. We classify publicly traded
equity securities as Level 1. When quoted market prices in active markets are not available, we base fair values on quoted market prices of comparable instruments or price estimates we obtain from independent pricing services. We classify our
fixed maturity investments and non-publicly traded equity securities as Level 2. Our fixed maturity investments consist of U.S. Treasury securities and obligations of U.S. government corporations and agencies, obligations of states and
political subdivisions, corporate securities and mortgage-backed securities.
At December 31, 2025, we received two estimates per security from the pricing services, and we priced substantially all of our Level 1 and Level 2 investments using those prices. In our review of the estimates the
pricing services provided at December 31, 2025, we did not identify any material discrepancies, and we did not make any adjustments to the estimates the pricing services provided.
We present our cash and short-term investments at estimated fair value. The carrying values in our balance sheet for premium receivables, reinsurance receivables related to paid losses and loss expenses and
reinsurance balances payable approximate their fair values. The carrying amounts reported in the balance sheet for our borrowings under lines of credit approximate their fair values. We classify these items as Level 3.
We evaluate our assets and liabilities on a regular basis to determine the appropriate level at which to classify them for each reporting period. Based on our review of the methodology and summary of inputs the
pricing services use, we have concluded that our Level 1 and Level 2 investments were classified properly at December 31, 2025 and 2024.
The following table presents our fair value measurements for our investments in available-for-sale fixed maturity and equity securities at December 31, 2025:
|
Fair Value Measurements Using
|
||||||||||||||||
|
Fair Value
|
Quoted Prices in
Active Markets
for Identical
Assets (Level 1)
|
Significant Other
Observable
Inputs (Level 2)
|
Significant
Unobservable
Inputs (Level 3)
|
|||||||||||||
|
U.S. Treasury securities and obligations of U.S. government corporations and agencies
|
$
|
|
$
|
|
$
|
|
$
|
|
||||||||
|
Obligations of states and political subdivisions
|
|
|
|
|
||||||||||||
|
Corporate securities
|
|
|
|
|
||||||||||||
|
Mortgage-backed securities
|
|
|
|
|
||||||||||||
|
Equity securities
|
|
|
|
|
||||||||||||
|
Total investments in the fair value hierarchy
|
$
|
|
$
|
|
$
|
|
$
|
|
||||||||
The following table presents our fair value measurements for our investments in available-for-sale fixed maturity and equity securities at December 31, 2024:
|
Fair Value Measurements Using
|
||||||||||||||||
|
Fair Value
|
Quoted Prices in
Active Markets
for Identical
Assets (Level 1)
|
Significant Other
Observable
Inputs (Level 2)
|
Significant
Unobservable
Inputs (Level 3)
|
|||||||||||||
|
U.S. Treasury securities and obligations of U.S. government corporations and agencies
|
$
|
|
$
|
|
$
|
|
$
|
|
||||||||
|
Obligations of states and political subdivisions
|
|
|
|
|
||||||||||||
|
Corporate securities
|
|
|
|
|
||||||||||||
|
Mortgage-backed securities
|
|
|
|
|
||||||||||||
|
Equity securities
|
|
|
|
|
||||||||||||
|
Total investments in the fair value hierarchy
|
$
|
|
$
|
|
$
|
|
$
|
|
||||||||
6 - Deferred Policy Acquisition Costs
Changes in our insurance subsidiaries’ deferred policy acquisition costs are as follows:
|
2025
|
2024
|
2023
|
||||||||||
|
Balance, January 1
|
$
|
|
$
|
|
$
|
|
||||||
|
Acquisition costs deferred
|
|
|
|
|||||||||
|
Amortization charged to earnings
|
( |
)
|
( |
)
|
( |
)
|
||||||
|
Balance, December 31
|
$
|
|
$
|
|
$
|
|
||||||
7 - Property and Equipment
Property and equipment at December 31, 2025 and 2024 consisted of the following:
|
2025
|
2024
|
Estimated Useful
Life
|
|||||||
|
Office equipment
|
$
|
|
$
|
|
|
||||
|
Automobiles
|
|
|
|
||||||
|
Real estate
|
|
|
|
||||||
|
Software
|
|
|
|
||||||
| |
|
||||||||
|
Accumulated depreciation
|
( |
)
|
( |
)
|
|||||
|
$
|
|
$
|
|
||||||
Depreciation expense for 2025, 2024 and 2023 amounted to $150,117 , $153,480 and $166,400 , respectively.
8 - Liability for Losses and Loss Expenses
The establishment of an appropriate liability for losses and loss expenses is an inherently uncertain process, and we can provide no assurance that our insurance subsidiaries’ ultimate liability will not exceed
their loss and loss expense reserves and have an adverse effect on our results of operations and financial condition. For example, legislative, judicial and regulatory actions may expand coverage definitions, retroactively mandate coverage or
otherwise require our insurance subsidiaries to pay losses for damages that their policies explicitly excluded or did not intend to cover. Furthermore, we cannot predict the timing, frequency and extent of adjustments to our insurance
subsidiaries’ estimated future liabilities, because the historical conditions and events that serve as a basis for our insurance subsidiaries’ estimates of ultimate claim costs may change. As is the case for substantially all property and
casualty insurance companies, our insurance subsidiaries have found it necessary in the past to increase their estimated future liabilities for losses and loss expenses in certain periods, and, in other periods, their estimates have exceeded
their actual liabilities. Changes in our insurance subsidiaries’ estimate of their liability for losses and loss expenses generally reflect actual payments and their evaluation of information received since the prior reporting date.
We summarize activity in our insurance subsidiaries’ liability for losses and loss expenses as follows:
|
2025
|
2024
|
2023
|
||||||||||
|
Balance at January 1
|
$
|
|
$
|
|
$
|
|
||||||
|
Less reinsurance recoverable
|
( |
)
|
( |
)
|
( |
) |
||||||
|
Cumulative effect of adoption of updated accounting guidance for credit losses at January 1
|
|
|
|
|||||||||
|
Net balance at January 1
|
|
|
|
|||||||||
|
Incurred related to:
|
||||||||||||
|
Current year
|
|
|
|
|||||||||
|
Prior years
|
( |
)
|
( |
)
|
( |
) |
||||||
|
Total incurred
|
|
|
|
|||||||||
|
Paid related to:
|
||||||||||||
|
Current year
|
|
|
|
|||||||||
|
Prior years
|
|
|
|
|||||||||
|
Total paid
|
|
|
|
|||||||||
|
Net balance at December 31
|
|
|
|
|||||||||
|
Plus reinsurance recoverable
|
|
|
|
|||||||||
|
Balance at December 31
|
$
|
|
$
|
|
$
|
|
||||||
Our insurance subsidiaries recognized a decrease in their liability for losses and loss expenses of prior years of $10.3 million, $15.0 million and $16.7 million in 2025, 2024 and 2023, respectively. Our insurance subsidiaries made no significant changes in their reserving philosophy or claims management personnel, and they have made no significant offsetting changes in estimates that increased or decreased their loss and loss expense reserves in those years. The 2025 development represented 1.5 % of the December 31, 2024 net carried reserves and resulted primarily from lower-than-expected loss emergence in all lines of business except other commercial lines (which is primarily commercial umbrella liability) for accident years prior to 2025. The majority of the 2025 development related to decreases in the liability for losses and loss expenses of prior years for Southern and Peninsula. The 2024 development represented 2.2 % of the December 31, 2023 net carried reserves and resulted primarily from lower-than-expected loss emergence in the commercial multi-peril, personal automobile and homeowners lines of business, offset partially by higher-than-expected loss emergence in the workers’ compensation and commercial automobile lines of business, for accident years prior to 2024. The majority of the 2024 development related to decreases in the liability for losses and loss expenses of prior years for Atlantic States and MICO. The 2023 development represented 2.5 % of the December 31, 2022 net carried reserves and resulted primarily from lower-than-expected loss emergence in the personal automobile and commercial automobile lines of business for accident years prior to 2023. The majority of the 2023 development related to decreases in the liability for losses and loss expenses of prior years for Atlantic States and MICO.
Short-duration contracts are contracts for which our insurance subsidiaries receive premiums that they recognize as revenue over the period of the contract in proportion to the amount of insurance protection our
insurance subsidiaries provide. Our insurance subsidiaries consider the policies they issue to be short-duration contracts. We consider our insurance subsidiaries’ material lines of business to be personal automobile, homeowners, commercial
automobile, commercial multi-peril and workers’ compensation.
Our insurance subsidiaries determine incurred but not reported (“IBNR”) reserves by subtracting the cumulative loss and loss expense amounts our insurance subsidiaries have paid and the case reserves our insurance
subsidiaries have established at the balance sheet date from their actuaries’ estimate of the ultimate cost of losses and loss expenses. Accordingly, our insurance subsidiaries’ IBNR reserves include their actuaries’ projections of the cost of
unreported claims as well as their actuaries’ projected development of case reserves on known claims and reopened claims. Our insurance subsidiaries’ methodology for estimating IBNR reserves has been in place for many years, and their actuaries
made no significant changes to that methodology during 2025.
The actuaries for our insurance subsidiaries generally prepare an initial estimate for ultimate losses and loss expenses for the current accident year by multiplying earned premium by an “a priori,” or expected, loss ratio for each line of business our insurance subsidiaries write. Expected loss ratios represent the actuaries’ expectation of losses at the time our insurance subsidiaries price and write their
policies, before the emergence of any actual claims experience. The actuaries determine an expected loss ratio by analyzing historical experience and adjusting for loss cost trends, loss frequency and severity trends, premium rate level
changes, reported and paid loss emergence patterns and other known or observed factors.
The actuaries use a variety of actuarial methods to estimate the ultimate cost of losses and loss expenses. These methods include paid loss development, incurred loss development and the Bornhuetter-Ferguson method
from which the actuaries select loss development factor assumptions. The actuaries base their selection of a point estimate on a judgmental weighting of estimates each of these methods produce.
The actuaries consider loss frequency and severity trends when they develop expected loss ratios and point estimates. Loss frequency is a measure of the number of claims per unit of insured exposure, and loss
severity is a measure of the average size of claims. Factors that affect loss frequency include changes in weather patterns or economic activity. Factors that affect loss severity include changes in policy limits, reinsurance retentions,
inflation rates and judicial interpretations.
Our insurance subsidiaries create a claim file when they receive notice of an actual demand for payment, an event that may lead to a demand for payment or when they otherwise determine that a demand for payment
could potentially lead to a future demand for payment on another coverage under the same policy or another policy they have issued. In recent years, our insurance subsidiaries have noted an increase in the period of time between the occurrence
of a casualty loss event and the date on which they receive notice of a liability claim. Changes in the length of time between the loss occurrence date and the claim reporting date affect the actuaries’ ability to accurately predict loss
frequency and the amount of IBNR reserves our insurance subsidiaries require.
Our insurance subsidiaries generally create a claim file for a policy at the claimant level by type of coverage and generally recognize one count for each claim event. In certain lines of business where it is
common for multiple parties to claim damages arising from a single claim event, our insurance subsidiaries recognize one count for each claimant involved in the event. Atlantic States recognizes one count for each claim event, or claimant
involved in a multiple-party claim event, related to losses Atlantic States assumes through its participation in its pooling agreement with Donegal Mutual. Our insurance subsidiaries accumulate the claim counts and report them by line of
business. For purposes of the claim development tables we present below, our insurance subsidiaries count claims on policies they issue even if they eventually close such claims without making a loss payment. Claims our insurance subsidiaries
close without making a loss payment typically generate loss expenses. The methods our insurance subsidiaries have used to summarize claim counts have not changed significantly over the time periods we report in the tables below.
The following tables present information about incurred and paid claims development as of December 31, 2025, net of reinsurance, as well as cumulative claim frequency and the total of IBNR reserves plus expected development on reported claims that our insurance subsidiaries included within their net incurred claims amounts. The tables include unaudited information about incurred and paid claims development for the years ended December 31, 2016 through 2024, which we present as supplementary information.
|
Personal
Automobile
|
At December 31, 2025
|
|||||||||||||||||||||||||||||||||||||||||||||||
|
Incurred Claims and Allocated Claim Adjustment Expenses, Net of Reinsurance
For the Year Ended December 31,
|
||||||||||||||||||||||||||||||||||||||||||||||||
|
Accident
Year
|
2016
|
2017
|
2018
|
2019
|
2020
|
2021
|
2022
|
2023
|
2024
|
2025
|
Total IBNR Plus Expected Development on Reported Claims
|
Cumulative Number of Reported Claims
|
||||||||||||||||||||||||||||||||||||
|
Unaudited
|
||||||||||||||||||||||||||||||||||||||||||||||||
|
(dollars and reported claims in thousands)
|
||||||||||||||||||||||||||||||||||||||||||||||||
|
2016
|
|
|
|
|
|
|
|
|
|
$
|
|
$
|
|
|
||||||||||||||||||||||||||||||||||
|
2017
|
|
|
|
|
|
|
|
|
|
|
|
|||||||||||||||||||||||||||||||||||||
|
2018
|
|
|
|
|
|
|
|
|
|
|
||||||||||||||||||||||||||||||||||||||
|
2019
|
|
|
|
|
|
|
|
|
|
|||||||||||||||||||||||||||||||||||||||
|
2020
|
|
|
|
|
|
|
|
|
||||||||||||||||||||||||||||||||||||||||
|
2021
|
|
|
|
|
|
|
|
|||||||||||||||||||||||||||||||||||||||||
|
2022
|
|
|
|
|
|
|
||||||||||||||||||||||||||||||||||||||||||
|
2023
|
|
|
|
|
|
|||||||||||||||||||||||||||||||||||||||||||
|
2024
|
|
|
|
|
||||||||||||||||||||||||||||||||||||||||||||
|
2025
|
|
|
|
|||||||||||||||||||||||||||||||||||||||||||||
|
|
Total
|
$
|
|
|||||||||||||||||||||||||||||||||||||||||||||
|
Personal
Automobile
|
||||||||||||||||||||||||||||||||||||||||
|
Cumulative Paid Claims and Allocated Claim Adjustment Expenses, Net of Reinsurance
For the Year Ended December 31,
|
||||||||||||||||||||||||||||||||||||||||
|
Accident
Year
|
2016
|
2017
|
2018
|
2019
|
2020
|
2021
|
2022
|
2023
|
2024
|
2025
|
||||||||||||||||||||||||||||||
|
Unaudited
|
||||||||||||||||||||||||||||||||||||||||
|
(in thousands)
|
||||||||||||||||||||||||||||||||||||||||
|
2016
|
|
|
|
|
|
|
|
|
|
$
|
|
|||||||||||||||||||||||||||||
|
2017
|
|
|
|
|
|
|
|
|
|
|||||||||||||||||||||||||||||||
|
2018
|
|
|
|
|
|
|
|
|
||||||||||||||||||||||||||||||||
|
2019
|
|
|
|
|
|
|
|
|||||||||||||||||||||||||||||||||
|
2020
|
|
|
|
|
|
|
||||||||||||||||||||||||||||||||||
|
2021
|
|
|
|
|
|
|||||||||||||||||||||||||||||||||||
|
2022
|
|
|
|
|
||||||||||||||||||||||||||||||||||||
|
2023
|
|
|
|
|||||||||||||||||||||||||||||||||||||
|
2024
|
|
|
||||||||||||||||||||||||||||||||||||||
|
2025
|
|
|||||||||||||||||||||||||||||||||||||||
|
|
Total
|
|
||||||||||||||||||||||||||||||||||||||
|
|
All outstanding liabilities before 2016, net of reinsurance
|
|
||||||||||||||||||||||||||||||||||||||
|
|
Liabilities for claims and claims adjustment expenses, net of reinsurance
|
$
|
|
|||||||||||||||||||||||||||||||||||||
|
Homeowners
|
At December 31, 2025
|
|||||||||||||||||||||||||||||||||||||||||||||||
|
Incurred Claims and Allocated Claim Adjustment Expenses, Net of Reinsurance
For the Year Ended December 31,
|
||||||||||||||||||||||||||||||||||||||||||||||||
|
Accident
Year
|
2016
|
2017
|
2018
|
2019
|
2020
|
2021
|
2022
|
2023
|
2024
|
2025
|
Total IBNR Plus Expected Development on Reported Claims
|
Cumulative Number of Reported Claims
|
||||||||||||||||||||||||||||||||||||
|
Unaudited
|
||||||||||||||||||||||||||||||||||||||||||||||||
|
(dollars and reported claims in thousands)
|
||||||||||||||||||||||||||||||||||||||||||||||||
|
2016
|
|
|
|
|
|
|
|
|
|
$
|
|
$
|
|
|
||||||||||||||||||||||||||||||||||
|
2017
|
|
|
|
|
|
|
|
|
|
|
|
|||||||||||||||||||||||||||||||||||||
|
2018
|
|
|
|
|
|
|
|
|
|
|
||||||||||||||||||||||||||||||||||||||
|
2019
|
|
|
|
|
|
|
|
|
|
|||||||||||||||||||||||||||||||||||||||
|
2020
|
|
|
|
|
|
|
|
|
||||||||||||||||||||||||||||||||||||||||
|
2021
|
|
|
|
|
|
|
|
|||||||||||||||||||||||||||||||||||||||||
|
2022
|
|
|
|
|
|
|
||||||||||||||||||||||||||||||||||||||||||
|
2023
|
|
|
|
|
|
|||||||||||||||||||||||||||||||||||||||||||
|
2024
|
|
|
|
|
||||||||||||||||||||||||||||||||||||||||||||
|
2025
|
|
|
|
|||||||||||||||||||||||||||||||||||||||||||||
|
|
Total
|
$
|
|
|||||||||||||||||||||||||||||||||||||||||||||
|
Homeowners
|
||||||||||||||||||||||||||||||||||||||||
|
Cumulative Paid Claims and Allocated Claim Adjustment Expenses, Net of Reinsurance
For the Year Ended December 31,
|
||||||||||||||||||||||||||||||||||||||||
|
Accident
Year
|
2016
|
2017
|
2018
|
2019
|
2020
|
2021
|
2022
|
2023
|
2024
|
2025
|
||||||||||||||||||||||||||||||
|
Unaudited
|
||||||||||||||||||||||||||||||||||||||||
|
(in thousands)
|
||||||||||||||||||||||||||||||||||||||||
|
2016
|
|
|
|
|
|
|
|
|
|
$
|
|
|||||||||||||||||||||||||||||
|
2017
|
|
|
|
|
|
|
|
|
|
|||||||||||||||||||||||||||||||
|
2018
|
|
|
|
|
|
|
|
|
||||||||||||||||||||||||||||||||
|
2019
|
|
|
|
|
|
|
|
|||||||||||||||||||||||||||||||||
|
2020
|
|
|
|
|
|
|
||||||||||||||||||||||||||||||||||
|
2021
|
|
|
|
|
|
|||||||||||||||||||||||||||||||||||
|
2022
|
|
|
|
|
||||||||||||||||||||||||||||||||||||
|
2023
|
|
|
|
|||||||||||||||||||||||||||||||||||||
|
2024
|
|
|
||||||||||||||||||||||||||||||||||||||
|
2025
|
|
|||||||||||||||||||||||||||||||||||||||
|
|
Total
|
|
||||||||||||||||||||||||||||||||||||||
|
|
All outstanding liabilities before 2016, net of reinsurance
|
|
||||||||||||||||||||||||||||||||||||||
|
|
Liabilities for claims and claims adjustment expenses, net of reinsurance
|
$
|
|
|||||||||||||||||||||||||||||||||||||
|
Commercial
Automobile
|
At December 31, 2025
|
|||||||||||||||||||||||||||||||||||||||||||||||
|
Incurred Claims and Allocated Claim Adjustment Expenses, Net of Reinsurance
For the Year Ended December 31,
|
||||||||||||||||||||||||||||||||||||||||||||||||
|
Accident
Year
|
2016
|
2017
|
2018
|
2019
|
2020
|
2021
|
2022
|
2023
|
2024
|
2025
|
Total IBNR Plus Expected Development on Reported Claims
|
Cumulative Number of Reported Claims
|
||||||||||||||||||||||||||||||||||||
|
Unaudited
|
||||||||||||||||||||||||||||||||||||||||||||||||
|
(dollars and reported claims in thousands)
|
||||||||||||||||||||||||||||||||||||||||||||||||
|
2016
|
|
|
|
|
|
|
|
|
|
$
|
|
$
|
|
|
||||||||||||||||||||||||||||||||||
|
2017
|
|
|
|
|
|
|
|
|
|
|
|
|||||||||||||||||||||||||||||||||||||
|
2018
|
|
|
|
|
|
|
|
|
|
|
||||||||||||||||||||||||||||||||||||||
|
2019
|
|
|
|
|
|
|
|
|
|
|||||||||||||||||||||||||||||||||||||||
|
2020
|
|
|
|
|
|
|
|
|
||||||||||||||||||||||||||||||||||||||||
|
2021
|
|
|
|
|
|
|
|
|||||||||||||||||||||||||||||||||||||||||
|
2022
|
|
|
|
|
|
|
||||||||||||||||||||||||||||||||||||||||||
|
2023
|
|
|
|
|
|
|||||||||||||||||||||||||||||||||||||||||||
|
2024
|
|
|
|
|
||||||||||||||||||||||||||||||||||||||||||||
|
2025
|
|
|
|
|||||||||||||||||||||||||||||||||||||||||||||
|
|
Total
|
$
|
|
|||||||||||||||||||||||||||||||||||||||||||||
|
Commercial
Automobile
|
||||||||||||||||||||||||||||||||||||||||
|
Cumulative Paid Claims and Allocated Claim Adjustment Expenses, Net of Reinsurance
For the Year Ended December 31,
|
||||||||||||||||||||||||||||||||||||||||
|
Accident
Year
|
2016
|
2017
|
2018
|
2019
|
2020
|
2021
|
2022
|
2023
|
2024
|
2025
|
||||||||||||||||||||||||||||||
|
Unaudited
|
||||||||||||||||||||||||||||||||||||||||
|
(in thousands)
|
||||||||||||||||||||||||||||||||||||||||
|
2016
|
|
|
|
|
|
|
|
|
|
$
|
|
|||||||||||||||||||||||||||||
|
2017
|
|
|
|
|
|
|
|
|
|
|||||||||||||||||||||||||||||||
|
2018
|
|
|
|
|
|
|
|
|
||||||||||||||||||||||||||||||||
|
2019
|
|
|
|
|
|
|
|
|||||||||||||||||||||||||||||||||
|
2020
|
|
|
|
|
|
|
||||||||||||||||||||||||||||||||||
|
2021
|
|
|
|
|
|
|||||||||||||||||||||||||||||||||||
|
2022
|
|
|
|
|
||||||||||||||||||||||||||||||||||||
|
2023
|
|
|
|
|||||||||||||||||||||||||||||||||||||
|
2024
|
|
|
||||||||||||||||||||||||||||||||||||||
|
2025
|
|
|||||||||||||||||||||||||||||||||||||||
|
|
Total
|
|
||||||||||||||||||||||||||||||||||||||
|
|
All outstanding liabilities before 2016, net of reinsurance
|
|
||||||||||||||||||||||||||||||||||||||
|
|
Liabilities for claims and claims adjustment expenses, net of reinsurance
|
$
|
|
|||||||||||||||||||||||||||||||||||||
|
Commercial
Multi-Peril
|
At December 31, 2025
|
|||||||||||||||||||||||||||||||||||||||||||||||
|
Incurred Claims and Allocated Claim Adjustment Expenses, Net of Reinsurance
For the Year Ended December 31,
|
||||||||||||||||||||||||||||||||||||||||||||||||
|
Accident
Year
|
2016
|
2017
|
2018
|
2019
|
2020
|
2021
|
2022
|
2023
|
2024
|
2025
|
Total IBNR Plus Expected Development on Reported Claims
|
Cumulative Number of Reported Claims
|
||||||||||||||||||||||||||||||||||||
|
Unaudited
|
||||||||||||||||||||||||||||||||||||||||||||||||
|
(dollars and reported claims in thousands)
|
||||||||||||||||||||||||||||||||||||||||||||||||
|
2016
|
|
|
|
|
|
|
|
|
|
$
|
|
$
|
|
|
||||||||||||||||||||||||||||||||||
|
2017
|
|
|
|
|
|
|
|
|
|
|
|
|||||||||||||||||||||||||||||||||||||
|
2018
|
|
|
|
|
|
|
|
|
|
|
||||||||||||||||||||||||||||||||||||||
|
2019
|
|
|
|
|
|
|
|
|
|
|||||||||||||||||||||||||||||||||||||||
|
2020
|
|
|
|
|
|
|
|
|
||||||||||||||||||||||||||||||||||||||||
|
2021
|
|
|
|
|
|
|
|
|||||||||||||||||||||||||||||||||||||||||
|
2022
|
|
|
|
|
|
|
||||||||||||||||||||||||||||||||||||||||||
|
2023
|
|
|
|
|
|
|||||||||||||||||||||||||||||||||||||||||||
|
2024
|
|
|
|
|
||||||||||||||||||||||||||||||||||||||||||||
|
2025
|
|
|
|
|||||||||||||||||||||||||||||||||||||||||||||
|
|
Total
|
$
|
|
|||||||||||||||||||||||||||||||||||||||||||||
|
Commercial Multi-Peril
|
||||||||||||||||||||||||||||||||||||||||
|
Cumulative Paid Claims and Allocated Claim Adjustment Expenses, Net of Reinsurance
For the Year Ended December 31,
|
||||||||||||||||||||||||||||||||||||||||
|
Accident
Year |
2016
|
2017
|
2018
|
2019
|
2020
|
2021
|
2022
|
2023
|
2024
|
2025
|
||||||||||||||||||||||||||||||
|
Unaudited
|
||||||||||||||||||||||||||||||||||||||||
|
(in thousands)
|
||||||||||||||||||||||||||||||||||||||||
|
2016
|
|
|
|
|
|
|
|
|
|
$
|
|
|||||||||||||||||||||||||||||
|
2017
|
|
|
|
|
|
|
|
|
|
|||||||||||||||||||||||||||||||
|
2018
|
|
|
|
|
|
|
|
|
||||||||||||||||||||||||||||||||
|
2019
|
|
|
|
|
|
|
|
|||||||||||||||||||||||||||||||||
|
2020
|
|
|
|
|
|
|
||||||||||||||||||||||||||||||||||
|
2021
|
|
|
|
|
|
|||||||||||||||||||||||||||||||||||
|
2022
|
|
|
|
|
||||||||||||||||||||||||||||||||||||
|
2023
|
|
|
|
|||||||||||||||||||||||||||||||||||||
|
2024
|
|
|
||||||||||||||||||||||||||||||||||||||
|
2025
|
|
|||||||||||||||||||||||||||||||||||||||
|
|
Total
|
|
||||||||||||||||||||||||||||||||||||||
|
|
All outstanding liabilities before 2016, net of reinsurance
|
|
||||||||||||||||||||||||||||||||||||||
|
|
Liabilities for claims and claims adjustment expenses, net of reinsurance
|
$
|
|
|||||||||||||||||||||||||||||||||||||
|
Workers’
Compensation
|
At December 31, 2025
|
|||||||||||||||||||||||||||||||||||||||||||||||
|
Incurred Claims and Allocated Claim Adjustment Expenses, Net of Reinsurance
For the Year Ended December 31,
|
||||||||||||||||||||||||||||||||||||||||||||||||
|
Accident Year
|
2016
|
2017
|
2018
|
2019
|
2020
|
2021
|
2022
|
2023
|
2024
|
2025
|
Total IBNR Plus Expected Development on Reported Claims
|
Cumulative Number of Reported Claims
|
||||||||||||||||||||||||||||||||||||
|
Unaudited
|
||||||||||||||||||||||||||||||||||||||||||||||||
|
(dollars and reported claims in thousands)
|
||||||||||||||||||||||||||||||||||||||||||||||||
|
2016
|
|
|
|
|
|
|
|
|
|
$
|
|
$
|
|
|
||||||||||||||||||||||||||||||||||
|
2017
|
|
|
|
|
|
|
|
|
|
|
|
|||||||||||||||||||||||||||||||||||||
|
2018
|
|
|
|
|
|
|
|
|
|
|
||||||||||||||||||||||||||||||||||||||
|
2019
|
|
|
|
|
|
|
|
|
|
|||||||||||||||||||||||||||||||||||||||
|
2020
|
|
|
|
|
|
|
|
|
||||||||||||||||||||||||||||||||||||||||
|
2021
|
|
|
|
|
|
|
|
|||||||||||||||||||||||||||||||||||||||||
|
2022
|
|
|
|
|
|
|
||||||||||||||||||||||||||||||||||||||||||
|
2023
|
|
|
|
|
|
|||||||||||||||||||||||||||||||||||||||||||
|
2024
|
|
|
|
|
||||||||||||||||||||||||||||||||||||||||||||
|
2025
|
|
|
|
|||||||||||||||||||||||||||||||||||||||||||||
|
|
Total
|
$
|
|
|||||||||||||||||||||||||||||||||||||||||||||
|
Workers’
Compensation
|
||||||||||||||||||||||||||||||||||||||||
|
Cumulative Paid Claims and Allocated Claim Adjustment Expenses, Net of Reinsurance
For the Year Ended December 31,
|
||||||||||||||||||||||||||||||||||||||||
|
Accident Year
|
2016
|
2017
|
2018
|
2019
|
2020
|
2021
|
2022
|
2023
|
2024
|
2025
|
||||||||||||||||||||||||||||||
|
Unaudited
|
||||||||||||||||||||||||||||||||||||||||
|
(in thousands)
|
||||||||||||||||||||||||||||||||||||||||
|
2016
|
|
|
|
|
|
|
|
|
|
$
|
|
|||||||||||||||||||||||||||||
|
2017
|
|
|
|
|
|
|
|
|
|
|||||||||||||||||||||||||||||||
|
2018
|
|
|
|
|
|
|
|
|
||||||||||||||||||||||||||||||||
|
2019
|
|
|
|
|
|
|
|
|||||||||||||||||||||||||||||||||
|
2020
|
|
|
|
|
|
|
||||||||||||||||||||||||||||||||||
|
2021
|
|
|
|
|
|
|||||||||||||||||||||||||||||||||||
|
2022
|
|
|
|
|
||||||||||||||||||||||||||||||||||||
|
2023
|
|
|
|
|||||||||||||||||||||||||||||||||||||
|
2024
|
|
|
||||||||||||||||||||||||||||||||||||||
|
2025
|
|
|||||||||||||||||||||||||||||||||||||||
|
|
Total
|
|
||||||||||||||||||||||||||||||||||||||
|
|
All outstanding liabilities before 2016, net of reinsurance
|
|
||||||||||||||||||||||||||||||||||||||
|
|
Liabilities for claims and claims adjustment expenses, net of reinsurance
|
$
|
|
|||||||||||||||||||||||||||||||||||||
The following table presents a reconciliation of the net incurred and paid claims development tables to the liability for claims and claims adjustment expenses in our consolidated balance sheet:
|
(in thousands)
|
At December 31,
2025
|
|||
|
Net outstanding liabilities:
|
||||
|
Personal automobile
|
$
|
|
||
|
Homeowners
|
|
|||
|
Commercial automobile
|
|
|||
|
Commercial multi-peril
|
|
|||
|
Workers’ compensation
|
|
|||
|
Other
|
|
|||
| |
||||
|
Reinsurance recoverable:
|
||||
|
Personal automobile
|
|
|||
|
Homeowners
|
|
|||
|
Commercial automobile
|
|
|||
|
Commercial multi-peril
|
|
|||
|
Workers’ compensation
|
|
|||
|
Other
|
|
|||
| |
||||
|
Unallocated loss adjustment expenses
|
|
|||
|
Gross liability for unpaid losses and loss expenses
|
$
|
|
||
The following table presents supplementary information about average historical claims duration as of December 31, 2025:
|
Average Annual Percentage Payout of Incurred Claims by Age, Net of Reinsurance
|
||||||||||||||||||||||||||||||||||||||||
|
Years
|
1
|
2
|
3
|
4
|
5
|
6
|
7
|
8
|
9
|
10
|
||||||||||||||||||||||||||||||
|
Personal automobile
|
|
%
|
|
%
|
|
%
|
|
%
|
|
%
|
|
%
|
|
%
|
|
%
|
|
%
|
|
%
|
||||||||||||||||||||
|
Homeowners
|
|
|
|
|
|
|
|
|
|
|
||||||||||||||||||||||||||||||
|
Commercial automobile
|
|
|
|
|
|
|
|
|
|
|
||||||||||||||||||||||||||||||
|
Commercial multi-peril
|
|
|
|
|
|
|
|
|
|
|
||||||||||||||||||||||||||||||
|
Workers’ compensation
|
|
|
|
|
|
|
|
|
|
|
||||||||||||||||||||||||||||||
9 - Borrowings
Lines of Credit
In August 2020, we entered into a credit agreement with Manufacturers and Traders Trust Company (“M&T”) that related to a $20.0 million unsecured demand line of credit. The line of credit has no expiration date, no annual fees and no covenants. At December 31, 2025, we had no outstanding borrowings from M&T and had the ability to borrow up to $20.0 million at interest rates equal to the then-current Term rate plus 2.11 %.
Atlantic States is a member of the FHLB of Pittsburgh. Through its membership, Atlantic States has the ability to issue debt to the FHLB of Pittsburgh in exchange for cash advances. Atlantic States has a fixed-rate cash advance of $35.0 million that was outstanding at December 31, 2025. The cash advance carries a fixed interest rate of 3.806 % and is due in .
The table below presents the amount of FHLB of Pittsburgh stock Atlantic States purchased, collateral pledged and assets related to Atlantic States’ membership in the FHLB of Pittsburgh at December 31, 2025.
|
FHLB stock purchased and owned as part of the agreement
|
$
|
|
||
| Collateral pledged, at par (carrying value $ |
|
|||
|
Borrowing capacity currently available
|
|
The following table reflects interest we paid during 2025, 2024 and 2023:
|
2025
|
2024
|
2023
|
||||||||||
|
Interest
|
$
|
|
$
|
|
$
|
|
||||||
10 - Reinsurance
Unaffiliated Reinsurers
Our insurance subsidiaries and Donegal Mutual participate in a consolidated third-party reinsurance program, for which the coverage and parameters are common to all of our insurance subsidiaries and Donegal Mutual.
The program utilizes several different reinsurers, all of which have an A.M. Best rating of A- (Excellent) or better or, with respect to foreign reinsurers, have a financial condition that, in the opinion of our management, is equivalent to a
company with at least an A- rating from A.M. Best. The following information describes the external reinsurance Donegal Mutual and our insurance subsidiaries had in place for 2025:
| • | for property insurance, excess of loss reinsurance that provided for coverage of $ |
| • | for liability insurance, excess of loss reinsurance that provided for coverage of $ |
| • | for workers' compensation insurance, excess of loss reinsurance that provided for coverage of $ |
For property insurance, our insurance subsidiaries had excess of loss reinsurance that provided for coverage of $36.0 million per loss over a set retention of $4.0 million. For liability insurance, our insurance subsidiaries had excess of loss reinsurance that provided for coverage of $69.0 million per occurrence over a set retention of $6.0 million. For workers’ compensation insurance, our insurance subsidiaries had excess of loss reinsurance that provided for coverage of $17.0 million on any one life over a set retention of $3.0 million.
As many as 30 reinsurers provided coverage for 2025 on any one treaty with no reinsurer taking more than 17 % of any one treaty. The amount of coverage provided under each of these types of reinsurance depended upon the amount, nature, size and location of the risks being reinsured.
In order to write automobile insurance in the State of Michigan, several of our insurance subsidiaries are required to be members of the Michigan Catastrophic Claims Association (“MCCA”). MCCA provides reinsurance
to those insurance subsidiaries for personal automobile and commercial automobile personal injury claims in the state of Michigan over a set retention.
In addition to the pooling agreement and third-party reinsurance, our insurance subsidiaries had a catastrophe reinsurance agreement with Donegal Mutual, under which each of our insurance subsidiaries recovered 100 % of an accumulation of multiple losses resulting from a single event, including natural disasters, over a set retention of $3.0 million up to aggregate losses of $22.0 million per occurrence. The agreement also provided additional coverage for an accumulation of losses from a single event including a combination of our insurance subsidiaries over a combined retention of $6.0 million. Several of our insurance subsidiaries also had a liability reinsurance agreement with Donegal Mutual, under which each of those participating insurance subsidiaries recovered 100 % of losses related to any liability claim over a set retention of $3.0 million up to losses of $3.0 million per occurrence.
Our insurance subsidiaries and Donegal Mutual also purchased facultative reinsurance to cover certain exposures, including property exposures in excess of the covered limits of their respective treaty reinsurance.
The following amounts represent ceded reinsurance transactions with unaffiliated reinsurers during 2025, 2024 and 2023:
|
2025
|
2024
|
2023
|
||||||||||
|
Premiums written
|
$
|
|
$
|
|
$
|
|
||||||
|
Premiums earned
|
|
|
|
|||||||||
|
Losses and loss expenses
|
( |
)
|
( |
)
|
|
|||||||
|
Prepaid reinsurance premiums
|
|
|
|
|||||||||
|
Liability for losses and loss expenses
|
|
|
|
|||||||||
Total Reinsurance
The following amounts represent total ceded reinsurance transactions with both affiliated and unaffiliated reinsurers during 2025, 2024 and 2023:
|
2025
|
2024
|
2023
|
||||||||||
|
Premiums earned
|
$
|
|
$
|
|
$
|
|
||||||
|
Losses and loss expenses
|
|
|
|
|||||||||
|
Prepaid reinsurance premiums
|
|
|
|
|||||||||
|
Liability for losses and loss expenses
|
|
|
|
|||||||||
The following amounts represent the effect of reinsurance on premiums written for 2025, 2024 and 2023:
|
2025
|
2024
|
2023
|
||||||||||
|
Direct
|
$
|
|
$
|
|
$
|
|
||||||
|
Assumed
|
|
|
|
|||||||||
|
Ceded
|
( |
)
|
( |
)
|
( |
)
|
||||||
|
Net premiums written
|
$
|
|
$
|
|
$
|
|
||||||
The following amounts represent the effect of reinsurance on premiums earned for 2025, 2024 and 2023:
|
2025
|
2024
|
2023
|
||||||||||
|
Direct
|
$
|
|
$
|
|
$
|
|
||||||
|
Assumed
|
|
|
|
|||||||||
|
Ceded
|
( |
)
|
( |
)
|
( |
)
|
||||||
|
Net premiums earned
|
$
|
|
$
|
|
$
|
|
||||||
|
Percentage of assumed premiums earned to net premiums earned
|
|
%
|
|
%
|
|
%
|
||||||
11 - Income Taxes
Our provision for income tax expense for 2025, 2024 and 2023 consisted of the following:
|
|
2025
|
2024
|
2023
|
|||||||||
|
Current income tax expense:
|
||||||||||||
|
U.S. federal
|
$
|
|
$
|
|
$
|
|
||||||
|
State
|
|
|
|
|||||||||
|
Deferred income tax expense (benefit):
|
||||||||||||
|
U.S. federal
|
|
$
|
( |
)
|
$
|
|
||||||
|
Total income tax expense included in the consolidated statements of income
|
$
|
|
$
|
|
$
|
|
||||||
The state income tax expense category was comprised of state taxes in Delaware.
Our effective tax rate is different from the amount computed at the U.S. federal statutory rate of 21 %. The reasons for such difference and the related tax effects are as follows:
|
|
2025
|
2024
|
2023
|
|||||||||||||||||||||
|
Income before income tax expense
|
$
|
|
$
|
|
$
|
|
||||||||||||||||||
|
Tax at U.S. federal statutory rate
|
%
|
%
|
%
|
|||||||||||||||||||||
|
State income taxes, net of federal income tax effect
|
|
|
|
|
|
|
||||||||||||||||||
|
Nontaxable or nondeductible items:
|
||||||||||||||||||||||||
|
Tax-exempt interest
|
( |
)
|
( |
)
|
( |
)
|
( |
)
|
( |
)
|
( |
)
|
||||||||||||
|
Proration
|
|
|
|
|
|
|
||||||||||||||||||
|
Dividends received deduction
|
( |
)
|
( |
)
|
( |
)
|
( |
)
|
( |
)
|
( |
)
|
||||||||||||
|
Stock options
|
( |
)
|
( |
)
|
|
|
|
|
||||||||||||||||
|
Fixed-maturity dispositions
|
|
|
( |
)
|
( |
)
|
|
|
||||||||||||||||
|
Other adjustments:
|
||||||||||||||||||||||||
|
Unrealized gain on equity securities
|
( |
)
|
( |
)
|
( |
)
|
( |
)
|
( |
)
|
( |
)
|
||||||||||||
|
Additional tax paid for prior year
|
|
|
( |
)
|
( |
)
|
|
|
||||||||||||||||
|
Other, net
|
|
|
|
|
|
|
||||||||||||||||||
|
Income tax expense
|
$
|
|
|
%
|
$
|
|
|
%
|
$
|
|
|
%
|
||||||||||||
Income taxes paid were as follows:
|
|
2025
|
2024
|
2023
|
|||||||||
|
U.S. federal
|
$
|
|
$
|
|
$
|
|
||||||
|
State
|
|
|
|
|||||||||
|
Total
|
$
|
|
$
|
|
$
|
|
||||||
The tax effects of temporary differences that give rise to significant portions of our deferred tax assets and deferred tax liabilities at December 31, 2025 and 2024 are as follows:
|
2025
|
2024
|
|||||||
|
Deferred tax assets:
|
||||||||
|
Unearned premium
|
$
|
|
$
|
|
||||
|
Loss reserves
|
|
|
||||||
|
Net unrealized losses
|
|
|
||||||
|
Net state operating loss carryforward - DGI Parent
|
|
|
||||||
|
Other
|
|
|
||||||
|
Total gross deferred tax assets
|
|
|
||||||
|
Less valuation allowance
|
( |
)
|
( |
)
|
||||
|
Net deferred tax assets
|
|
|
||||||
|
Deferred tax liabilities:
|
||||||||
|
Deferred policy acquisition costs
|
|
|
||||||
|
Loss reserve transition adjustment
|
|
|
||||||
|
Other
|
|
|
||||||
|
Total gross deferred tax liabilities
|
|
|
||||||
|
Net deferred tax asset
|
$
|
|
$
|
|
||||
We provide a valuation allowance when we believe it is more likely than not that we will not realize some portion of a deferred tax asset. At December 31, 2025 and 2024, we established a valuation allowance of $7.5 million and $7.6 million, respectively, for our net state operating loss carryforward. We determined that we were not required to establish a valuation allowance for the other net deferred tax assets of $31.8 million and $37.5 million at December 31, 2025 and 2024, respectively, since it is more likely than not that we will realize these deferred tax assets through reversals of existing temporary differences, future taxable income and our implementation of tax-planning strategies.
We are no longer subject to income tax examinations for tax years prior to 2016. In 2019, the Internal Revenue Service (“IRS”) began a federal income tax audit of our consolidated tax returns for tax years 2016 to
2018. No material issues have been raised and no adjustments have been proposed as a result of this ongoing audit.
On July 4, 2025, a budget reconciliation package referred to as the One Big Beautiful Bill Act of 2025 (the “OBBBA”) was enacted. The tax provisions included within the OBBBA did not have a material impact on our
financial position, results of operations or cash flows.
12 - Stockholders’ Equity
Each share of our Class A common stock outstanding at the time of the declaration of any dividend or other distribution payable in cash upon the shares of our Class B common stock is entitled to a dividend or distribution payable at the same time and to stockholders of record on the same date in an amount at least 10 % greater than any dividend declared upon each share of our Class B common stock. In the event of our merger or consolidation with or into another entity, the holders of our Class A common stock and the holders of our Class B common stock are entitled to receive the same per share consideration in such merger or consolidation. In the event of our liquidation, dissolution or winding-up, any assets available to common stockholders will be distributed pro-rata to the holders of our Class A common stock and our Class B common stock after payment of all of our obligations.
On July 18, 2013, our board of directors authorized a share repurchase program pursuant to which we have the authority to purchase up to 500,000 additional shares of our Class A common stock at prices prevailing from time to time in the open market subject to the provisions of the SEC Rule 10b-18 and in privately negotiated transactions. We did no 57,658 shares of our Class A common stock under this program from its inception through December 31, 2025.
At December 31, 2025 and 2024, our treasury stock consisted of 3,002,588 72,465
13 - Stock Compensation Plans
Equity Incentive Plans
Since 1996, we have maintained an Equity Incentive Plan for Employees. During 2024, we adopted a plan that made a total of 4,500,000 shares of Class A common stock available for issuance to employees of our subsidiaries and affiliates. The plan provides for the granting of awards by our board of directors in the form of stock options, restricted stock, restricted stock units, other stock-based awards or any combination of the above. The plan provides that stock options may become exercisable up to ten years from their date of grant, with an option price not less than fair market value on the date preceding the date of grant.
Since 1996, we have maintained an Equity Incentive Plan for Directors. During 2024, we adopted a new plan that made 500,000 shares of Class A common stock available for issuance to our directors and the directors of our subsidiaries and affiliates. We may make awards under this plan in the form of stock options, restricted stock, restricted stock units, other stock-based awards or any combination of the above. The plan also provides for the issuance of 500 shares of restricted stock on the first business day of January in each year to each of our directors and each director of Donegal Mutual who does not serve as one of our directors. We issued 8,000 shares of restricted stock on January 2, 2025 under our director plan. We issued 8,500
No further shares are available for future equity grants for plans in effect prior to 2024.
We measure all share-based payments to employees, including grants of employee stock options, using a fair-value-based method and record such expense in our results of operations. In determining the expense we
record for stock options granted to directors and employees of our subsidiaries and affiliates, we estimate the fair value of each option award on the date of grant using the Black-Scholes option pricing model. The significant assumptions we
utilize in applying the Black-Scholes option pricing model are the risk-free interest rate, expected term, dividend yield and expected volatility. The risk-free interest rate is the implied yield currently available on U.S. Treasury zero coupon
issues with a remaining term equal to the expected term used as the assumption in the model. We base the expected term of an option award on our historical experience for similar awards. We determine the dividend yield by dividing the per share
dividend by the grant date stock price. We base the expected volatility on the volatility of our stock price over a historical period comparable to the expected term.
We historically granted stock options on an annual basis at our December board meeting, which occurs in the middle of December. At its December 18, 2025 board meeting, our board of directors approved the recommendation of the compensation committee to change the form of equity awards we issue on an annual basis from stock options to restricted stock units and to delay issuance until the first day of the next calendar year. Accordingly, we did no t grant any restricted stock units during 2025. On January 1, 2026, we granted restricted stock unit awards to our officers and the officers of Donegal Mutual that will vest in three equal annual installments. We plan to grant restricted stock units on January 1 of each year. This practice will allow for vesting under each grant to occur on the same date and for the value of shares our named executive officers receive upon vesting of multiple grants to be calculated consistently using the closing price of Class A common stock on the last trading day of the preceding year.
The weighted-average grant date fair value of options we granted during 2024 was $1.41 . We calculated this fair value based upon a risk-free interest rate of 4.35 %, an expected life of three years , an expected volatility of 16 % and an expected dividend yield of 4.4 %.
The weighted-average grant date fair value of options we granted during 2023 was $1.51 . We calculated this fair value based upon a risk-free interest rate of 4.12 %, an expected life of three years , an expected volatility of 20 % and an expected dividend yield of 5 %.
We charged compensation expense for our stock compensation plans against income before income taxes of $1.0 million, $980,911 and $876,569 for the years ended December 31, 2025, 2024 and 2023, respectively, with a corresponding income tax benefit of $210,355 , $205,991 and $184,079 . At December 31, 2025 and 2024, our total unrecognized compensation cost related to non-vested share-based compensation granted under our stock compensation plans was $794,210 and $1.8 million, respectively. We expect to recognize this cost over a weighted average period of 1.2 years.
During 2025, we received cash from option exercises under all stock compensation plans of $18.9 million. We realized actual tax benefits for the tax deductions from option exercises of share-based compensation of $1.3 million for 2025. During 2024, we received cash from option exercises under all stock compensation plans of $30.7 million. We realized actual tax benefits for the tax deductions from option exercises of share-based compensation of $370,644 for 2024. During 2023, we received cash from option exercises under all stock compensation plans of $6.8 million. We realized actual tax benefits for the tax deductions from option exercises of share-based compensation of $139,135 for 2023.
Information regarding activity in our stock option plans follows:
|
Number of Options
|
Weighted-Average Exercise Price Per Share
|
|||||||
|
Outstanding at December 31, 2022
|
|
|
||||||
|
Granted - 2023
|
|
|
||||||
|
Exercised - 2023
|
( |
)
|
|
|||||
|
Forfeited - 2023
|
( |
)
|
|
|||||
|
Expired - 2023
|
( |
)
|
|
|||||
|
Outstanding at December 31, 2023
|
|
|
||||||
|
Granted - 2024
|
|
|
||||||
|
Exercised - 2024
|
( |
)
|
|
|||||
|
Forfeited - 2024
|
( |
)
|
|
|||||
|
Expired - 2024
|
( |
)
|
|
|||||
|
Outstanding at December 31, 2024
|
|
|
||||||
|
Granted - 2025
|
|
|
||||||
|
Exercised - 2025
|
( |
)
|
|
|||||
|
Forfeited - 2025
|
( |
)
|
|
|||||
|
Expired - 2025
|
( |
)
|
|
|||||
|
Outstanding at December 31, 2025
|
|
$
|
|
|||||
|
Exercisable at:
|
||||||||
|
December 31, 2023
|
|
$
|
|
|||||
|
December 31, 2024
|
|
$
|
|
|||||
|
December 31, 2025
|
|
$
|
|
|||||
Shares available for future option grants at December 31, 2025 totaled 4,104,500 shares under all plans.
The following table summarizes information about stock options outstanding at December 31, 2025:
| Grant Date | Exercise Price | Number of Options Outstanding | Weighted-Average Remaining Contractual Life | Number of Options Exercisable | |||||||||
| December 16, 2021 | | | | | |||||||||
| December 15, 2022 | | | | | |||||||||
| December 21, 2023 | | | | | |||||||||
| December 19, 2024 | | | | | |||||||||
| Total | | | |||||||||||
Employee Stock Purchase Plan
Since 1996, we have maintained an Employee Stock Purchase Plan. During 2021, we adopted a plan that made 500,000 shares of our Class A common stock available for issuance and extends over a 10 -year period. The plan provides for shares to be offered to all eligible employees at a purchase price equal to the lesser of 85 % of the fair market value of our Class A common stock on the last day before the first day of each enrollment period (June 1 and December 1 of each year) under the plan or 85 % of the fair market value of our Class A common stock on the last day of each subscription period (June 30 and December 31 of each year).
A summary of plan activity follows:
|
Shares Issued
|
||||||||
|
Price
|
Shares
|
|||||||
|
January 1, 2023
|
$
|
|
|
|||||
|
July 1, 2023
|
|
|
||||||
|
January 1, 2024
|
|
|
||||||
|
July 1, 2024
|
|
|
||||||
|
January 1, 2025
|
|
|
||||||
|
July 1, 2025
|
|
|
||||||
On January 1, 2026, we issued 22,283 shares at a price of $16.98 per share under this plan. Following this issuance, we had 256,385 shares available for issuance under this plan.
Agency Stock Purchase Plan
Since 1996, we have maintained an Agency Stock Purchase Plan. During 2021, we adopted a plan that made 500,000 shares of our Class A common stock available for issuance to agents of our insurance subsidiaries and Donegal Mutual. During 2024, we adopted a new plan that made 500,000 shares of our Class A common stock available for issuance to agents of our insurance subsidiaries and Donegal Mutual. The plan permits an agent to invest up to $12,000 per subscription period (April 1 to September 30 and October 1 to March 31 of each year) under various methods. We issue stock at the end of each subscription period at a price equal to 90 % of the average market price during the last ten trading days of each subscription period. During 2025, we issued 49,200 shares under the 2024 plan. Following this issuance, we had 450,800 shares available for issuance under the 2024 plan. During 2024 and 2023, we issued 81,180 and 86,469 shares, respectively, under the 2021 plan. The expense we recognized under this plan was not material.
14 - Statutory Net Income, Capital and Surplus and Dividend Restrictions
The following table presents selected information, as filed with state insurance regulatory authorities, for our insurance subsidiaries as determined in accordance with accounting practices prescribed or permitted by such insurance regulatory authorities:
|
2025
|
2024
|
2023
|
||||||||||
|
Atlantic States:
|
||||||||||||
|
Statutory capital and surplus
|
$
|
|
$
|
|
$
|
|
||||||
|
Statutory unassigned surplus
|
|
|
|
|||||||||
|
Statutory net income
|
|
|
|
|||||||||
|
MICO:
|
||||||||||||
|
Statutory capital and surplus
|
|
|
|
|||||||||
|
Statutory unassigned surplus
|
|
|
|
|||||||||
|
Statutory net income
|
|
|
|
|||||||||
|
Peninsula:
|
||||||||||||
|
Statutory capital and surplus
|
|
|
|
|||||||||
|
Statutory unassigned surplus
|
|
|
|
|||||||||
|
Statutory net income
|
|
|
|
|||||||||
|
Southern:
|
||||||||||||
|
Statutory capital and surplus
|
|
|
|
|||||||||
|
Statutory unassigned surplus
|
( |
)
|
( |
)
|
( |
)
|
||||||
|
Statutory net income (loss)
|
|
( |
)
|
( |
)
|
|||||||
We rely on dividends from our insurance subsidiaries as a significant source of cash for payment of dividends to our stockholders. State insurance laws require our insurance subsidiaries to maintain certain minimum capital and surplus amounts on a statutory basis. Our insurance subsidiaries are subject to regulations that restrict the payment of dividends from statutory surplus and may require prior approval of their domiciliary insurance regulatory authorities. Our insurance subsidiaries are also subject to risk-based capital (“RBC”) requirements that may further impact their ability to pay dividends. Our insurance subsidiaries’ statutory capital and surplus at December 31, 2025 exceeded the amount of statutory capital and surplus necessary to satisfy regulatory requirements, including the RBC requirements, by a significant margin. Amounts available for distribution to us as dividends from our insurance subsidiaries without prior approval of insurance regulatory authorities in 2026 are approximately $50.8 million from Atlantic States, $10.2 million from MICO and $5.4 million from Peninsula, or a total of approximately $66.4 million.
15 - Reconciliation of Statutory Filings to Amounts Reported in the Consolidated Financial Statements
Our insurance subsidiaries must file financial statements with state insurance regulatory authorities using accounting principles and practices prescribed or permitted by those authorities. We refer to these
accounting principles and practices as statutory accounting principles (“SAP”). Accounting principles used to prepare these SAP financial statements differ from those used to prepare financial statements on the basis of GAAP.
Reconciliations of statutory net income (loss) and capital and surplus, as determined using SAP, to the net income and stockholders’ equity amounts included in the accompanying consolidated financial statements are as follows:
|
Year Ended December 31,
|
||||||||||||
|
2025
|
2024
|
2023
|
||||||||||
|
Statutory net income (loss) of insurance subsidiaries
|
$
|
|
$
|
|
$
|
( |
)
|
|||||
|
Increases (decreases):
|
||||||||||||
|
Deferred policy acquisition costs
|
( |
)
|
( |
)
|
|
|||||||
|
Deferred federal income taxes
|
( |
)
|
|
( |
)
|
|||||||
|
Salvage and subrogation recoverable
|
|
|
|
|||||||||
|
Consolidating eliminations and adjustments
|
( |
)
|
( |
)
|
( |
)
|
||||||
|
Parent-only net income
|
|
|
|
|||||||||
|
Net income
|
$
|
|
$
|
|
$
|
|
||||||
|
December 31,
|
||||||||||||
|
2025
|
2024
|
2023
|
||||||||||
|
Statutory capital and surplus of insurance subsidiaries
|
$
|
|
$
|
|
$
|
|
||||||
|
Increases (decreases):
|
||||||||||||
|
Deferred policy acquisition costs
|
|
|
|
|||||||||
|
Deferred federal income taxes
|
( |
)
|
( |
)
|
( |
)
|
||||||
|
Salvage and subrogation recoverable
|
|
|
|
|||||||||
|
Non-admitted assets and other adjustments, net
|
|
|
|
|||||||||
|
Fixed maturities
|
( |
)
|
( |
)
|
( |
)
|
||||||
|
Parent-only equity and other adjustments
|
( |
)
|
( |
)
|
( |
)
|
||||||
|
Stockholders’ equity
|
$
|
|
$
|
|
$
|
|
||||||
16 - Earnings Per Share
We have two classes of common stock, which we refer to as Class A common stock and Class B common stock. Our Class A common stock is entitled to be paid cash dividends that are at least 10 % higher than the cash dividends we pay on our Class B common stock. Accordingly, we use the two-class method for the computation of earnings per common share. The two-class method is an earnings allocation formula that determines earnings per share separately for each class of common stock based on dividends declared and an allocation of remaining undistributed earnings using a participation percentage reflecting the dividend rights of each class.
We present below a reconciliation of the numerators and denominators we used in the basic and diluted per share computations for our Class A common stock:
|
Year Ended December 31,
|
||||||||||||
|
(in thousands)
|
2025
|
2024
|
2023
|
|||||||||
|
Basic earnings per share:
|
||||||||||||
|
Numerator:
|
||||||||||||
|
Allocation of net income
|
$
|
|
$
|
|
$
|
|
||||||
|
Denominator:
|
||||||||||||
|
Weighted-average shares outstanding
|
|
|
|
|||||||||
|
Basic earnings per share
|
$
|
|
$
|
|
$
|
|
||||||
|
Diluted earnings per share:
|
||||||||||||
|
Numerator:
|
||||||||||||
|
Allocation of net income
|
$
|
|
$
|
|
$
|
|
||||||
|
Denominator:
|
||||||||||||
|
Number of shares used in basic computation
|
|
|
|
|||||||||
|
Weighted-average effect of dilutive securities
|
||||||||||||
|
Add: Director and employee stock options
|
|
|
|
|||||||||
|
Number of shares used in per share computations
|
|
|
|
|||||||||
|
Diluted earnings per share
|
$
|
|
$
|
|
$
|
|
||||||
We used the following information in the basic and diluted per share computations for our Class B common stock:
|
Year Ended December 31,
|
||||||||||||
|
(in thousands)
|
2025
|
2024
|
2023
|
|||||||||
|
Basic and diluted earnings per share:
|
||||||||||||
|
Numerator:
|
||||||||||||
|
Allocation of net income
|
$
|
|
$
|
|
$
|
|
||||||
|
Denominator:
|
||||||||||||
|
Weighted-average shares outstanding
|
|
|
|
|||||||||
|
Basic and diluted earnings per share
|
$
|
|
$
|
|
$
|
|
||||||
17 - Condensed Financial Information of Parent Company
Condensed Balance Sheets
(in thousands)
|
December 31,
|
2025
|
2024
|
||||||
|
Assets
|
||||||||
|
Investment in subsidiaries/affiliates (equity method)
|
$
|
|
$
|
|
||||
|
Short-term investments
|
|
|
||||||
|
Cash
|
|
|
||||||
|
Property and equipment
|
|
|
||||||
|
Other
|
|
|
||||||
|
Total assets
|
$
|
|
$
|
|
||||
|
Liabilities and Stockholders’ Equity
|
||||||||
|
Liabilities
|
||||||||
|
Cash dividends declared to stockholders
|
$
|
|
$
|
|
||||
|
Notes payable to subsidiary
|
|
|
||||||
|
Other
|
|
|
||||||
|
Total liabilities
|
|
|
||||||
|
Stockholders’ equity
|
|
|
||||||
|
Total liabilities and stockholders’ equity
|
$
|
|
$
|
|
||||
Condensed Statements of Income and Comprehensive Income
(in thousands)
|
Year Ended December 31,
|
2025
|
2024
|
2023
|
|||||||||
|
Statements of Income
|
||||||||||||
|
Revenues
|
||||||||||||
|
Dividends from subsidiaries
|
$
|
|
$
|
|
$
|
|
||||||
|
Other
|
|
|
|
|||||||||
|
Total revenues
|
|
|
|
|||||||||
|
Expenses
|
||||||||||||
|
Operating expenses
|
|
|
|
|||||||||
|
Interest
|
|
|
|
|||||||||
|
Total expenses
|
|
|
|
|||||||||
|
Income before income tax benefit and equity in undistributed net income (loss) of subsidiaries
|
|
|
|
|||||||||
|
Income tax benefit
|
( |
)
|
( |
)
|
( |
)
|
||||||
|
Income before equity in undistributed net income (loss) of subsidiaries
|
|
|
|
|||||||||
|
Equity in undistributed net income (loss) of subsidiaries
|
|
|
( |
)
|
||||||||
|
Net income
|
$
|
|
$
|
|
$
|
|
||||||
|
Statements of Comprehensive Income
|
||||||||||||
|
Net income
|
$
|
|
$
|
|
$
|
|
||||||
|
Other comprehensive income, net of tax
|
||||||||||||
|
Unrealized gain - subsidiaries
|
|
|
|
|||||||||
|
Other comprehensive income, net of tax
|
|
|
|
|||||||||
|
Comprehensive income
|
$
|
|
$
|
|
$
|
|
||||||
Condensed Statements of Cash Flows
(in thousands)
|
Year Ended December 31,
|
2025
|
2024
|
2023
|
|||||||||
|
Cash flows from operating activities:
|
||||||||||||
|
Net income
|
$
|
|
$
|
|
$
|
|
||||||
|
Adjustments:
|
||||||||||||
|
Equity in undistributed net (income) loss of subsidiaries
|
( |
)
|
( |
)
|
|
|||||||
|
Other
|
( |
)
|
|
( |
)
|
|||||||
|
Net adjustments
|
( |
)
|
( |
)
|
|
|||||||
|
Net cash provided
|
|
|
|
|||||||||
|
Cash flows from investing activities:
|
||||||||||||
|
Net (purchase) sale of short-term investments
|
( |
)
|
( |
)
|
|
|||||||
|
Net purchase of property and equipment
|
|
|
( |
)
|
||||||||
|
Investment in subsidiaries
|
( |
)
|
( |
)
|
( |
)
|
||||||
|
Other
|
|
|
|
|||||||||
|
Net cash (used) received
|
( |
)
|
( |
)
|
|
|||||||
|
Cash flows from financing activities:
|
||||||||||||
|
Cash dividends paid
|
( |
)
|
( |
)
|
( |
)
|
||||||
|
Issuance of common stock
|
|
|
|
|||||||||
|
Net cash (used) received
|
( |
)
|
|
( |
)
|
|||||||
|
Net change in cash
|
( |
)
|
|
|
||||||||
|
Cash at beginning of year
|
|
|
|
|||||||||
|
Cash at end of year
|
$
|
|
$
|
|
$
|
|
||||||
18 - Segment Information
We have three reportable segments, which consist of our investment function, our commercial lines of insurance and our personal lines of insurance. Using independent agents, our insurance subsidiaries market commercial lines of insurance to small and medium-sized businesses and personal lines of insurance to individuals.
Our chief operating decision maker, which is our Chief Executive Officer, evaluates the performance of the commercial lines and personal lines primarily based upon our insurance subsidiaries’ underwriting results
as determined under SAP. This segmentation is consistent with the segmentation we utilize to manage our business. We make resource allocation decisions based upon historical underwriting results as well as perceived opportunities for future
profitable growth within each segment.
We operate only in the United States, and no single customer or agent provides 10 percent or more of our revenues.
Financial data by segment is as follows:
|
2025
|
||||||||||||||||
|
Investments
|
Commercial Lines
|
Personal
Lines
|
Total
|
|||||||||||||
|
(in thousands)
|
||||||||||||||||
|
Revenues:
|
||||||||||||||||
|
Net premiums earned
|
$
|
|
$
|
|
$
|
|
$
|
|
||||||||
|
Net investment income
|
|
|
|
|
||||||||||||
|
Investment gains
|
|
|
|
|
||||||||||||
|
Total segment revenues
|
|
|
|
|
||||||||||||
|
Other
|
|
|||||||||||||||
|
Total revenues
|
$
|
|
||||||||||||||
|
Segment expenses:
|
||||||||||||||||
|
Net losses and loss expenses
|
|
|
|
|
||||||||||||
|
Other underwriting expenses
|
|
|
|
|
||||||||||||
|
Policyholder dividends
|
|
|
|
|
||||||||||||
|
Total segment expenses
|
|
|
|
|
||||||||||||
|
SAP underwriting income
|
|
|
|
|
||||||||||||
|
GAAP adjustments
|
( |
)
|
||||||||||||||
|
GAAP underwriting income
|
|
|||||||||||||||
|
Net investment income
|
|
|||||||||||||||
|
Investment gains
|
|
|||||||||||||||
|
Other
|
|
|||||||||||||||
|
Income before income tax expense
|
$
|
|
||||||||||||||
|
2024
|
||||||||||||||||
|
Investments
|
Commercial Lines
|
Personal
Lines
|
Total
|
|||||||||||||
|
(in thousands)
|
||||||||||||||||
|
Revenues:
|
||||||||||||||||
|
Net premiums earned
|
$
|
|
$
|
|
$
|
|
$
|
|
||||||||
|
Net investment income
|
|
|
|
|
||||||||||||
|
Investment gains
|
|
|
|
|
||||||||||||
|
Total segment revenues
|
|
|
|
|
||||||||||||
|
Other
|
|
|||||||||||||||
|
Total revenues
|
$
|
|
||||||||||||||
|
Segment expenses:
|
||||||||||||||||
|
Net losses and loss expenses
|
|
|
|
|
||||||||||||
|
Other underwriting expenses
|
|
|
|
|
||||||||||||
|
Policyholder dividends
|
|
|
|
|
||||||||||||
|
Total segment expenses
|
|
|
|
|
||||||||||||
|
SAP underwriting income
|
|
|
|
|
||||||||||||
|
GAAP adjustments
|
|
|||||||||||||||
|
GAAP underwriting income
|
|
|||||||||||||||
|
Net investment income
|
|
|||||||||||||||
|
Investment gains
|
|
|||||||||||||||
|
Other
|
( |
)
|
||||||||||||||
|
Income before income tax expense
|
$
|
|
||||||||||||||
|
2023
|
||||||||||||||||
|
Investments
|
Commercial Lines
|
Personal
Lines
|
Total
|
|||||||||||||
|
(in thousands)
|
||||||||||||||||
|
Revenues:
|
||||||||||||||||
|
Net premiums earned
|
$
|
|
$
|
|
$
|
|
$
|
|
||||||||
|
Net investment income
|
|
|
|
|
||||||||||||
|
Investment losses
|
|
|
|
|
||||||||||||
|
Total segment revenues
|
|
|
|
|
||||||||||||
|
Other
|
|
|||||||||||||||
|
Total revenues
|
$
|
|
||||||||||||||
|
Segment expenses:
|
||||||||||||||||
|
Net losses and loss expenses
|
|
|
|
|
||||||||||||
|
Other underwriting expenses
|
|
|
|
|
||||||||||||
|
Policyholder dividends
|
|
|
|
|
||||||||||||
|
Total segment expenses
|
|
|
|
|
||||||||||||
|
SAP underwriting loss
|
|
( |
)
|
( |
)
|
( |
)
|
|||||||||
|
GAAP adjustments
|
|
|||||||||||||||
|
GAAP underwriting loss
|
( |
)
|
||||||||||||||
|
Net investment income
|
|
|||||||||||||||
|
Investment gains
|
|
|||||||||||||||
|
Other
|
( |
)
|
||||||||||||||
|
Income before income tax expense
|
$
|
|
||||||||||||||
19 - Guaranty Fund and Other Insurance-Related Assessments
Our insurance subsidiaries’ liabilities for guaranty fund and other insurance-related assessments were $1.9 551,867 and $668,722 related to surcharges collected by our insurance subsidiaries on behalf of regulatory authorities for 2025 and 2024, respectively.
20 - Allowance for Expected Credit Losses
Pursuant to new accounting guidance we adopted on January 1, 2023, we make estimates with respect to the potential impairment of financial instruments and recognize expected credit losses as an allowance rather
than impairments as credit losses are incurred. We refer to Note 2 - Impact of New Accounting Standards for more information regarding the new accounting guidance. We have established allowances for expected credit losses with respect to
held-to-maturity debt securities and reinsurance receivable.
Held-to-Maturity Debt Securities
For held-to-maturity debt securities, we make estimates concerning expected credit losses at an aggregated level rather that monitoring individual debt securities for credit losses. We establish an allowance for
expected credit losses based on an ongoing review of securities held, historical loss data, changes in issuer credit standing and other relevant factors. We utilize a probability-of-default methodology, which reflects current and forecasted
economic conditions, to estimate the allowance for expected credit losses and recognize changes to the allowance in our results of operations.
The following table presents the balances for fixed maturities classified as held-to-maturity, net of the allowance for expected credit losses, at December 31, 2025 and 2024 and changes in the allowance for expected credit losses for 2025 and 2024.
|
At and For the Year Ended December 31, 2025
|
At and For the Year Ended December 31, 2024
|
|||||||||||||||
|
Held-to-
Maturity, Net
of Allowance for Expected
Credit Losses
|
Allowance for
Expected
Credit Losses
|
Held-to-
Maturity, Net of
Allowance for
Expected
Credit Losses
|
Allowance for
Expected
Credit Losses
|
|||||||||||||
|
(in thousands)
|
||||||||||||||||
|
Balance at beginning of period
|
$
|
|
$
|
|
$
|
|
$
|
|
||||||||
|
Current period change for expected credit losses
|
( |
)
|
|
|||||||||||||
|
Balance at end of period
|
$
|
|
$
|
|
$
|
|
$
|
|
||||||||
Reinsurance Receivable
For reinsurance receivable, we establish an allowance for expected credit losses based upon our ongoing review of amounts outstanding, historical loss data, changes in reinsurer credit standing and other relevant
factors. We utilize a probability-of-default methodology, which reflects current and forecasted economic conditions, to estimate the allowance for expected credit losses and recognize changes to the allowance in our results of operations.
The following table presents the balances for reinsurance receivable, net of the allowance for expected credit losses, at December 31, 2025 and 2024 and changes in the allowance for expected credit losses for 2025 and 2024.
|
At and For the Year Ended December 31, 2025
|
At and For the Year Ended December 31, 2024
|
|||||||||||||||
|
Reinsurance
Receivable, Net
of Allowance
for Expected
Credit Losses
|
Allowance for
Expected
Credit Losses
|
Reinsurance
Receivable, Net
of Allowance
for Expected
Credit Losses |
Allowance for
Expected Credit
Losses
|
|||||||||||||
|
(in thousands)
|
||||||||||||||||
|
Balance at beginning of period
|
$
|
|
$
|
|
$
|
|
$
|
|
||||||||
|
Current period change for expected credit losses
|
( |
)
|
( |
)
|
||||||||||||
|
Balance at end of period
|
$
|
|
$
|
|
$
|
|
$
|
|
||||||||
To the Stockholders and Board of Directors
Donegal Group Inc.:
Opinion on the Consolidated Financial Statements
We have audited the accompanying consolidated balance sheets of Donegal Group Inc. and subsidiaries (the Company) as of December 31, 2025 and 2024, the related consolidated statements of income and comprehensive
income, stockholders’ equity, and cash flows for each of the years in the three-year period ended December 31, 2025, and the related notes and financial statement schedule III (collectively, the consolidated financial statements). In our
opinion, the consolidated financial statements present fairly, in all material respects, the financial position of the Company as of December 31, 2025 and 2024, and the results of its operations and its cash flows for each of the years in the
three-year period ended December 31, 2025, in conformity with U.S. generally accepted accounting principles.
We also have audited, in accordance with the standards of the Public Company Accounting Oversight Board (United States) (PCAOB), the Company’s internal control over financial reporting as of December 31, 2025,
based on criteria established in Internal Control – Integrated Framework (2013) issued by the Committee of Sponsoring Organizations of the Treadway Commission, and our report dated March 6, 2026
expressed an unqualified opinion on the effectiveness of the Company’s internal control over financial reporting.
Basis for Opinion
These consolidated financial statements are the responsibility of the Company’s management. Our responsibility is to express an opinion on these consolidated financial statements based on our audits. We are a
public accounting firm registered with the PCAOB and are required to be independent with respect to the Company in accordance with the U.S. federal securities laws and the applicable rules and regulations of the Securities and Exchange
Commission and the PCAOB.
We conducted our audits in accordance with the standards of the PCAOB. Those standards require that we plan and perform the audit to obtain reasonable assurance about whether the consolidated financial statements
are free of material misstatement, whether due to error or fraud. Our audits included performing procedures to assess the risks of material misstatement of the consolidated financial statements, whether due to error or fraud, and performing
procedures that respond to those risks. Such procedures included examining, on a test basis, evidence regarding the amounts and disclosures in the consolidated financial statements. Our audits also included evaluating the accounting principles
used and significant estimates made by management, as well as evaluating the overall presentation of the consolidated financial statements. We believe that our audits provide a reasonable basis for our opinion.
Critical Audit Matter
The critical audit matter communicated below is a matter arising from the current period audit of the consolidated financial statements that was communicated or required to be communicated to the audit committee
and that: (1) relates to accounts or disclosures that are material to the consolidated financial statements and (2) involved our especially challenging, subjective, or complex judgments. The communication of a critical audit matter does not
alter in any way our opinion on the consolidated financial statements, taken as a whole, and we are not, by communicating the critical audit matter below, providing a separate opinion on the critical audit matter or on the accounts or
disclosures to which it relates.
Estimate of Liabilities for Losses and Loss Expenses
As discussed in Notes 1 and 8 to the consolidated financial statements, the Company estimates the liabilities for losses and loss expenses (reserves) through an internal reserve analysis that
relies upon generally accepted actuarial practices. The Company develops reserve estimates by line of business and, as experience emerges and other information develops, the reserve estimates are assessed in aggregate and adjusted as necessary.
As of December 31, 2025, the Company recorded a liability of $1.1 billion for reserves.
We identified the evaluation of the estimate of reserves as a critical audit matter. The evaluation of the Company’s estimate of reserves involved a high degree of auditor judgment due to the
inherent uncertainties in the use of actuarial methods and assumptions, which considered internal and external factors. Assumptions included the selection of loss development factors, a priori ratios,
and the weighting of actuarial methods when more than one was used. Evaluating the actuarial methods and assumptions required specialized skills and auditor judgment.
The following are the primary procedures we performed to address this critical audit matter. We evaluated, with the involvement of actuarial professionals, when appropriate, the design and tested
the operating effectiveness of certain internal controls related to the Company’s reserving process. These included controls related to the Company’s actuarial analyses and determination of the Company’s estimate of recorded reserves. We
involved actuarial professionals with specialized skills and knowledge, who assisted in:
| • |
evaluating the Company’s actuarial methods by comparing them to generally accepted actuarial practices
|
| • |
developing an independent estimate of reserves for certain lines of business using methods consistent with generally accepted actuarial practices by independently forming assumptions of loss development factors, a priori ratios, and
the weighting of actuarial methods when more than one was used, considering internal and external factors
|
| • |
assessing the Company’s internal actuarial analysis for certain lines of business by reviewing the assumptions and actuarial methods used, which included the selection of loss development factors, a priori ratios, and the weighting of actuarial methods when more than one was used, considering internal and external factors
|
| • |
developing a range of reserves and comparing to the Company’s recorded reserves and assessing movement of the Company’s recorded reserves within that range.
|
We have served as the Company’s auditor since 1986.
 |
|
|
Philadelphia, Pennsylvania
|
|
|
March 6, 2026
|
| Item 9. |
Changes in and Disagreements with Accountants on Accounting and Financial Disclosure.
|
None.
| Item 9A. |
Controls and Procedures.
|
Evaluation of Disclosure Controls and Procedures
Our management, with the participation of our Chief Executive Officer and our Chief Financial Officer, has evaluated the effectiveness of our disclosure controls and procedures (as such term is defined in Rules
13a-15(e) and 15d-15(e) under the Exchange Act) at December 31, 2025 covered by this Form 10-K Report. Based on such evaluation, our Chief Executive Officer and our Chief Financial Officer have concluded that, at December 31, 2025, our
disclosure controls and procedures are effective in recording, processing, summarizing and reporting, on a timely basis, information we are required to disclose in the reports that we file or submit under the Exchange Act and our disclosure
controls and procedures are also effective to ensure that information we disclose in the reports we file or submit under the Exchange Act is accumulated and communicated to our management, including our Chief Executive Officer and our Chief
Financial Officer, to allow timely decisions regarding required disclosure.
Management’s Report on Internal Control over Financial Reporting
Our management is responsible for establishing and maintaining adequate internal control over financial reporting, as that term is defined in Rule 13a-15(f) under the Exchange Act. Under the supervision and with
the participation of our Chief Executive Officer and our Chief Financial Officer, our management has conducted an evaluation of the effectiveness of our internal control over financial reporting based on the framework and criteria established
in Internal Control - Integrated Framework (2013) issued by the Committee of Sponsoring Organizations of the Treadway Commission (the “COSO Framework”). Based on our evaluation under the COSO Framework,
our management has concluded that our internal control over financial reporting was effective at December 31, 2025.
The effectiveness of our internal control over financial reporting at December 31, 2025 has been audited by KPMG LLP, an independent registered public accounting firm, as stated in its report, which is included in
this Form 10-K Report.
Changes in Internal Control over Financial Reporting
There were no changes to our internal control over financial reporting (as such term is defined in Rules 13a-15(f) and 15d-15(f) under the Exchange Act) that occurred during the fourth quarter of 2025 that have
materially affected, or are reasonably likely to materially affect, our internal control over financial reporting.
| Item 9B. |
Other Information.
|
Trading Arrangements of Directors and Executive Officers
During the three months ended December 31, 2025, no director or officer of the Company adopted terminated
| Item 9C. |
Disclosure Regarding Foreign Jurisdictions that Prevent Inspections.
|
Not applicable.
Report of Independent Registered Public Accounting Firm
To the Stockholders and Board of Directors
Donegal Group Inc.:
Opinion on Internal Control Over Financial Reporting
We have audited Donegal Group Inc. and subsidiaries’ (the Company) internal control over financial reporting as of December 31, 2025, based on criteria established in Internal
Control – Integrated Framework (2013) issued by the Committee of Sponsoring Organizations of the Treadway Commission. In our opinion, the Company maintained, in all material respects, effective internal control over financial
reporting as of December 31, 2025, based on criteria established in Internal Control – Integrated Framework (2013) issued by the Committee of Sponsoring Organizations of the Treadway Commission.
We also have audited, in accordance with the standards of the Public Company Accounting Oversight Board (United States) (PCAOB), the consolidated balance sheets of the Company as of December 31, 2025 and December
31, 2024, the related consolidated statements of income and comprehensive income, stockholders’ equity, and cash flows for each of the years in the three-year period ended December 31, 2025, and the related notes and financial statement
schedules III (collectively, the consolidated financial statements), and our report dated March 6, 2026 expressed an unqualified opinion on those consolidated financial statements.
Basis for Opinion
The Company’s management is responsible for maintaining effective internal control over financial reporting and for its assessment of the effectiveness of internal control over financial reporting, included in the
accompanying Management’s Report on Internal Control over Financial Reporting. Our responsibility is to express an opinion on the Company’s internal control over financial reporting based on our audit. We are a public accounting firm registered
with the PCAOB and are required to be independent with respect to the Company in accordance with the U.S. federal securities laws and the applicable rules and regulations of the Securities and Exchange Commission and the PCAOB.
We conducted our audit in accordance with the standards of the PCAOB. Those standards require that we plan and perform the audit to obtain reasonable assurance about whether effective internal control over
financial reporting was maintained in all material respects. Our audit of internal control over financial reporting included obtaining an understanding of internal control over financial reporting, assessing the risk that a material weakness
exists, and testing and evaluating the design and operating effectiveness of internal control based on the assessed risk. Our audit also included performing such other procedures as we considered necessary in the circumstances. We believe that
our audit provides a reasonable basis for our opinion.
Definition and Limitations of Internal Control Over Financial Reporting
A company’s internal control over financial reporting is a process designed to provide reasonable assurance regarding the reliability of financial reporting and the preparation of financial statements for external
purposes in accordance with generally accepted accounting principles. A company’s internal control over financial reporting includes those policies and procedures that (1) pertain to the maintenance of records that, in reasonable detail,
accurately and fairly reflect the transactions and dispositions of the assets of the company; (2) provide reasonable assurance that transactions are recorded as necessary to permit preparation of financial statements in accordance with
generally accepted accounting principles, and that receipts and expenditures of the company are being made only in accordance with authorizations of management and directors of the company; and (3) provide reasonable assurance regarding
prevention or timely detection of unauthorized acquisition, use, or disposition of the company’s assets that could have a material effect on the financial statements.
Because of its inherent limitations, internal control over financial reporting may not prevent or detect misstatements. Also, projections of any evaluation of effectiveness to future periods are subject to the risk
that controls may become inadequate because of changes in conditions, or that the degree of compliance with the policies or procedures may deteriorate.
| | |
| March 6, 2026 |
PART III
| Item 10. |
Directors, Executive Officers and Corporate Governance.
|
Other than the information we provide below and the information regarding executive officers included in Part I of this Form 10-K Report, we incorporate the response to this Item 10 by reference to our proxy
statement we will file with the SEC on or about March 16, 2026 relating to our annual meeting of stockholders that we will hold on April 16, 2026, or our Proxy Statement.
We incorporate the full text of our Code of Business Conduct and Ethics by reference to Exhibit 14 to this Form 10-K Report.
| Item 11. |
Executive Compensation.
|
We incorporate the response to this Item 11 by reference to our Proxy Statement. Neither the Report of our Compensation Committee nor the Report of our Audit Committee included in our Proxy Statement shall
constitute or be deemed to constitute a filing with the SEC under the Securities Act or the Exchange Act or be deemed to have been incorporated by reference into any filing we make under the Securities Act or the Exchange Act, except to the
extent we specifically incorporate the Report of Our Compensation Committee or the Report of Our Audit Committee by reference.
| Item 12. |
Security Ownership of Certain Beneficial Owners and Management and Related Stockholder Matters.
|
We incorporate the response to this Item 12 by reference to our Proxy Statement.
| Item 13. |
Certain Relationships and Related Transactions, and Director Independence.
|
We incorporate the response to this Item 13 by reference to our Proxy Statement.
| Item 14. |
Principal Accounting Fees and Services.
|
We incorporate the response to this Item 14 by reference to our Proxy Statement.
PART IV
| Item 15. |
Exhibits, Financial Statement Schedules.
|
| (a) |
Financial statements, financial statement schedule and exhibits filed:
|
| (i) |
Consolidated Financial Statements
|
|
Page
|
|
|
108
|
|
|
Donegal Group Inc. and Subsidiaries:
|
|
| 65 | |
| 66 | |
| 67 | |
| 68 | |
| 69 | |
|
Report and Consent of Independent Registered Public Accounting Firm
|
|
|
(Filed as Exhibit 23.1)
|
| (b) |
Financial Statement Schedule
|
| 116 | |
|
Filed herewith
|
|
We have omitted all other schedules since they are not required, not applicable or the information is included in the financial statements or notes to the financial statements.
| (c) |
Exhibits
|
|
Exhibit No.
|
Description of Exhibits
|
Reference
|
||
|
3.1
|
(g)
|
|||
|
3.2
|
(m)
|
|||
|
3.3
|
(n)
|
|||
|
4.1
|
(j)
|
|||
|
Management Contracts and Compensatory Plans or Arrangements
|
||||
|
10.1
|
(i)
|
|||
|
10.2
|
(i)
|
|||
|
10.3
|
(o)
|
|||
|
10.4
|
(a)
|
|||
|
10.5
|
(a)
|
|||
|
10.6
|
(b)
|
|||
|
10.7
|
(b)
|
|||
|
10.8
|
(b)
|
|||
|
10.9
|
(b)
|
|||
|
10.10
|
(c)
|
|||
|
10.11
|
(h)
|
|||
|
10.12
|
(h)
|
|||
|
10.13
|
(l)
|
|||
|
10.14
|
(o)
|
|||
|
10.15
|
(o)
|
|||
|
10.16
|
(q)
|
|||
|
10.17
|
(r)
|
|||
|
10.18
|
(r)
|
|||
| 10.19 | Donegal Group Inc. Cash Incentive Bonus Plan
for 2025 |
(t) |
||
|
10.20
|
Filed herewith
|
|||
|
10.21
|
Filed herewith
|
|||
|
Other Material Contracts
|
||||
|
10.22
|
(e)
|
|||
|
10.23
|
(f)
|
|||
|
10.24
|
(k)
|
|||
|
10.25
|
(f)
|
|||
|
10.26
|
(j)
|
|||
|
10.27
|
(p)
|
|||
|
10.28
|
(s)
|
|||
|
14
|
(d)
|
|||
|
19
|
Filed herewith
|
|||
|
21
|
Filed herewith
|
|||
|
23.1
|
Filed herewith
|
|||
|
31.1
|
Filed herewith
|
|||
|
31.2
|
Filed herewith
|
|||
|
32.1
|
Filed herewith
|
|||
|
32.2
|
Filed herewith
|
|||
|
97.1
|
(q)
|
|||
|
Exhibit 101.INS
|
XBRL Instance Document
|
Filed herewith
|
||
|
Exhibit 101.SCH
|
XBRL Taxonomy Extension Schema Document
|
Filed herewith
|
||
|
Exhibit 101.PRE
|
XBRL Taxonomy Presentation Linkbase Document
|
Filed herewith
|
||
|
Exhibit 101.CAL
|
XBRL Taxonomy Calculation Linkbase Document
|
Filed herewith
|
||
|
Exhibit 101.LAB
|
XBRL Taxonomy Label Linkbase Document
|
Filed herewith
|
||
|
Exhibit 101.DEF
|
XBRL Taxonomy Extension Definition Linkbase Document
|
Filed herewith
|
| (a) |
We incorporate such exhibit by reference to the like-described exhibit in Registrant’s Form 10-K Report for the year ended December 31, 1999.
|
| (b) |
We incorporate such exhibit by reference to the like-described exhibit in Registrant’s Form 10-K Report for the year ended December 31, 2001.
|
| (c) |
We incorporate such exhibit by reference to the like-described exhibit in Registrant’s Form 10-K Report for the year ended December 31, 2002.
|
| (d) |
We incorporate such exhibit by reference to the like-described exhibit in Registrant’s Form 10-K Report for the year ended December 31, 2003.
|
| (e) |
We incorporate such exhibit by reference to the like-described exhibit in Registrant’s Form 10-K Report for the year ended December 31, 2009.
|
| (f) |
We incorporate such exhibit by reference to the like-described exhibit in Registrant’s Form 10-K Report for the year ended December 31, 2010.
|
| (g) |
We incorporate such exhibit by reference to the like-described exhibit in Registrant’s Form 10-Q Report for the quarter ended June 30, 2019.
|
| (h) |
We incorporate such exhibit by reference to the copy of such plan in Registrant’s definitive proxy statement for its Annual Meeting of Stockholders held on April 18, 2019 filed on March 18, 2019.
|
| (i) |
We incorporate such exhibit by reference to the like-described exhibit in Registrant’s Form 8-K Report dated October 1, 2020.
|
| (j) |
We incorporate such exhibit by reference to the like-described exhibit in Registrant’s Form 10-K Report for the year ended December 31, 2020.
|
| (k) |
We incorporate such exhibit by reference to the like-described exhibit in Registrant’s Form 10-K Report for the year ended December 31, 2021.
|
| (l) |
We incorporate such exhibit by reference to the copy of such plan in Registrant’s definitive proxy statement for its Annual Meeting of Stockholders held on April 15, 2021 filed on March 15, 2021.
|
| (m) |
We incorporate such exhibit by reference to the like-described exhibit in Registrant’s Form 8-K Report dated July 22, 2022.
|
| (n) |
We incorporate such exhibit by reference to the like-described exhibit in Registrant’s Form 8-K Report dated August 10, 2022.
|
| (o) |
We incorporate such exhibit by reference to the like-described exhibit in Registrant’s Form 10-K Report for the year ended December 31, 2022.
|
| (p) |
We incorporate such exhibit by reference to the like-described exhibit in Registrant’s Form 10-Q Report for the quarter ended June 30, 2023.
|
| (q) |
We incorporate such exhibit by reference to the like-described exhibit in Registrant’s Form 10-K Report for the year ended December 31, 2023.
|
| (r) |
We incorporate such exhibit by reference to the copy of such plan in Registrant’s definitive proxy statement for its Annual Meeting of Stockholders held on April 18, 2024 filed on March 15, 2024.
|
| (s) |
We incorporate such exhibit by reference to the like-described exhibit in Registrant’s For S-3 Registration Statement filed on August 30, 2024.
|
| (t) |
We incorporate such exhibit by reference to the like-described exhibit in Registrant’s Form 10-K Report for the year ended December 31, 2024.
|
| Item 16. |
Form 10-K Summary.
|
None.
DONEGAL GROUP INC. AND SUBSIDIARIES
SCHEDULE III — SUPPLEMENTARY INSURANCE INFORMATION
Years Ended December 31, 2025, 2024 and 2023
($ in thousands)
|
Segment
|
Net
Premiums
Earned
|
Net
Investment
Income
|
Net Losses
and Loss
Expenses
|
Amortization
of Deferred
Policy
Acquisition
Costs
|
Other
Underwriting
Expenses
|
Net
Premiums
Written
|
||||||||||||||||||
|
Year Ended December 31, 2025
|
||||||||||||||||||||||||
|
Commercial lines
|
$
|
|
$
|
|
$
|
|
$
|
|
$
|
|
$
|
|
||||||||||||
|
Personal lines
|
|
|
|
|
|
|
||||||||||||||||||
|
Investments
|
|
|
|
|
|
|
||||||||||||||||||
|
$
|
|
$
|
|
$
|
|
$
|
|
$
|
|
$
|
|
|||||||||||||
|
Year Ended December 31, 2024
|
||||||||||||||||||||||||
|
Commercial lines
|
$
|
|
$
|
|
$
|
|
$
|
|
$
|
|
$
|
|
||||||||||||
|
Personal lines
|
|
|
|
|
|
|
||||||||||||||||||
|
Investments
|
|
|
|
|
|
|
||||||||||||||||||
|
$
|
|
$
|
|
$
|
|
$
|
|
$
|
|
$
|
|
|||||||||||||
|
Year Ended December 31, 2023
|
||||||||||||||||||||||||
|
Commercial lines
|
$
|
|
$
|
|
$
|
|
$
|
|
$
|
|
$
|
|
||||||||||||
|
Personal lines
|
|
|
|
|
|
|
||||||||||||||||||
|
Investments
|
|
|
|
|
|
|
||||||||||||||||||
|
$
|
|
$
|
|
$
|
|
$
|
|
$
|
|
$
|
|
|||||||||||||
DONEGAL GROUP INC. AND SUBSIDIARIES
SCHEDULE III — SUPPLEMENTARY INSURANCE INFORMATION, CONTINUED
($ in thousands)
|
At December 31,
|
||||||||||||||||
|
Segment
|
Deferred
Policy
Acquisition
Costs
|
Liability
For Losses
and Loss
Expenses
|
Unearned
Premiums
|
Other Policy
Claims and
Benefits
Payable
|
||||||||||||
|
2025
|
||||||||||||||||
|
Commercial lines
|
$
|
|
$
|
|
$
|
|
$
|
|
||||||||
|
Personal lines
|
|
|
|
|
||||||||||||
|
Investments
|
|
|
|
|
||||||||||||
|
$
|
|
$
|
|
$
|
|
$
|
|
|||||||||
|
2024
|
||||||||||||||||
|
Commercial lines
|
$
|
|
$
|
|
$
|
|
$
|
|
||||||||
|
Personal lines
|
|
|
|
|
||||||||||||
|
Investments
|
|
|
|
|
||||||||||||
|
$
|
|
$
|
|
$
|
|
$
|
|
|||||||||
SIGNATURES
Pursuant to the requirements of Section 13 or 15(d) of the Securities Exchange Act of 1934, the Registrant has duly caused this report to be signed on its behalf by the undersigned, thereunto duly authorized.
|
DONEGAL GROUP INC.
|
||
|
By:
|
/s/ Kevin G. Burke
|
|
|
Kevin G. Burke, President and Chief Executive Officer
|
||
Date: March 6, 2026
Pursuant to the requirements of the Securities Exchange Act of 1934, this report has been signed by the following persons on behalf of the Registrant in the capacities and on the dates indicated.
|
Signature
|
Title
|
Date
|
||
|
/s/ Kevin G. Burke
|
President, Chief Executive Officer and a Director
|
March 6, 2026
|
||
|
Kevin G. Burke
|
(principal executive officer)
|
|||
|
/s/ Jeffrey D. Miller
|
Executive Vice President and Chief Financial Officer
|
March 6, 2026
|
||
|
Jeffrey D. Miller
|
(principal financial and accounting officer)
|
|||
|
/s/ Dennis J. Bixenman
|
Director
|
March 6, 2026
|
||
|
Dennis J. Bixenman
|
||||
|
/s/ Jack L. Hess
|
Director
|
March 6, 2026
|
||
|
Jack L. Hess
|
||||
|
/s/ Barry C. Huber
|
Director
|
March 6, 2026
|
||
|
Barry C. Huber
|
||||
|
/s/ David C. King
|
Director
|
March 6, 2026
|
||
|
David C. King
|
||||
|
/s/ Kevin M. Kraft, Sr.
|
Director
|
March 6, 2026
|
||
|
Kevin M. Kraft, Sr.
|
||||
|
/s/ Jon M. Mahan
|
Director
|
March 6, 2026
|
||
|
Jon M. Mahan
|
||||
|
/s/ S. Trezevant Moore, Jr.
|
Director
|
March 6, 2026
|
||
|
S. Trezevant Moore, Jr.
|
||||
|
/s/ Britta H. Schatz
|
Director
|
March 6, 2026
|
||
|
Britta H. Schatz
|
||||
|
/s/ Annette B. Szady
|
Director
|
March 6, 2026
|
||
|
Annette B. Szady
|
-118-
DONEGAL MUTUAL INSURANCE COMPANY
DONEGAL GROUP INC.
2026 ANNUAL EXECUTIVE INCENTIVE PLAN
Purpose
The 2026 Annual Executive Incentive Plan (the “Plan”) provides for the payment of performance-based bonuses to Plan participants based upon the Donegal Insurance Group’s achievement of performance objectives for individual performance measures
according to the weighting assigned to each performance measure.
The performance objectives correlate to incentive levels that represent percentages of a participant’s 2026 base salary (as defined in this Plan). The potential bonuses available for Plan participants with respect to the performance measures
will be based on the incentive levels, performance objectives and weighting percentages as outlined in Appendix 1.
Scope
The performance measures and objectives, unless otherwise specified, relate to the statutory financial results of the Donegal Insurance Group, which includes the following legal entities for the purposes of this Plan:
Donegal Mutual Insurance Company
Atlantic States Insurance Company
Michigan Insurance Company
Mountain States Commercial Insurance Company
Mountain States Indemnity Company
Peninsula Indemnity Company
Peninsula Insurance Company
Southern Insurance Company of Virginia
Southern Mutual Insurance Company
Performance Measures
Commercial Lines Premium Growth – annual growth in commercial lines direct premiums written compared to the previous calendar year total.
Adjusted Statutory Combined Ratio – reported statutory combined ratio excluding any catastrophe adjustment, all executive incentive plan bonus accruals and an equity incentive compensation expense adjustment (see definitions below).
1
Operating Return on Equity – Donegal Group Inc.’s consolidated GAAP net income excluding net investment gains or losses divided by average GAAP stockholders’ equity excluding accumulated other comprehensive income or loss (average of current
year-end and prior year-end values).
Bonus Formula
Each participant in this Plan shall be eligible to receive a bonus that represents the sum of the performance bonuses such participant earns for each respective performance measure. Each performance bonus shall be calculated by multiplying the
participant’s 2026 base salary, as defined in this Plan, by the bonus percentage that correlates to the incentive level achieved and multiplying that result by the weighting percentage assigned to the respective performance measure. The calculation
methodology is illustrated below:
| • |
Base Salary x Incentive Level Bonus % x Weighting % = Performance Bonus
|
| • |
Sum of Performance Bonuses = Total Bonus Earned
|
Key Definitions
Base Salary – total wages as reported on a participant’s W-2 for 2026, excluding any taxable fringe benefits, short or long-term disability pay, gains from exercise of stock options, equity incentive compensation and prior-year bonus.
Statutory Combined Ratio – sum of the net loss and loss expense ratio (net losses and loss expenses incurred divided by net premiums earned), the expense ratio (underwriting expenses less installment fee income divided by net premiums written)
and the dividend ratio (policyholder dividends incurred divided by net premiums earned).
Catastrophe Adjustment – an adjustment will be provided to the statutory combined ratio for the purpose of this Plan to limit the net effect of the single largest catastrophe event occurring in 2026 to $15 million. For purposes of this
provision, a catastrophe event is defined as an event to which the Property Claims Services unit of Verisk Analytics, Inc. assigns a catastrophe number and for which the net effect to the Donegal Insurance Group exceeds $15 million when aggregating
losses incurred, LAE incurred and reinstatement premiums payable to reinsurers.
Equity Incentive Compensation Expense Adjustment – an adjustment will be provided to statutory combined ratio for the purpose of this Plan to remove the effect of equity incentive compensation expense included in the statutory financial
statements.
2
Additional Provisions
| 1. |
Participants must be employed by Donegal Mutual Insurance Company on or before October 1, 2026 to be eligible to participate in this Plan. Participants must be employed by the Donegal Mutual Insurance Company on December 31, 2026 in
order to receive a bonus payment under this Plan.
|
| 2. |
No bonus is payable under this Plan unless the employees and managers of Donegal Mutual Insurance Company qualify for bonuses under their respective incentive plans.
|
| 3. |
Any bonuses earned under this Plan shall be paid prior to March 15, 2027.
|
| 4. |
Approved participants in this Plan are listed in Appendix 1. Any changes to the participants in this Plan and the incentive levels for such participants must be approved by the Joint Compensation Committee of the Boards of Directors of
Donegal Mutual Insurance Company and Donegal Group Inc. (“the Joint Compensation Committee”).
|
| 5. |
This Plan provides for a discretionary pool calculated in similar fashion to the bonuses for Plan participants using a “base salary” equivalent of $1,000,000. The discretionary pool may be allocated among participants in this Plan or
other officers, managers or employees in the sole discretion of the Joint Compensation Committee. The President shall provide a recommendation to the Joint Compensation Committee with respect to high performers who should be considered for
allocations from the discretionary pool.
|
| 6. |
Payment of bonuses under this Plan may be capped by the Joint Compensation Committee in their sole discretion.
|
3
Appendix 1
The participants and incentive levels for the 2026 Annual Executive Incentive Plan are as follows:
|
Participants
|
Incentive Levels - Bonus % of Salary
|
||||||
|
Threshold
|
Level 1
|
Level 2
|
Target
|
Level 3
|
Level 4
|
Maximum
|
|
|
Kevin G. Burke
|
40
|
50
|
60
|
70
|
80
|
90
|
100
|
|
W. Daniel DeLamater
|
40
|
50
|
60
|
70
|
80
|
90
|
100
|
|
Jeffery T. Hay
|
40
|
50
|
60
|
70
|
80
|
90
|
100
|
|
Jeffrey D. Miller
|
40
|
50
|
60
|
70
|
80
|
90
|
100
|
|
Sanjay Pandey
|
40
|
50
|
60
|
70
|
80
|
90
|
100
|
|
Kristi S. Altshuler
|
40
|
50
|
60
|
70
|
80
|
90
|
100
|
|
David B. Bawel
|
40
|
50
|
60
|
70
|
80
|
90
|
100
|
|
Noland R. Deas, Jr.
|
40
|
50
|
60
|
70
|
80
|
90
|
100
|
|
William A. Folmar
|
40
|
50
|
60
|
70
|
80
|
90
|
100
|
|
Rick J. Hecker
|
40
|
50
|
60
|
70
|
80
|
90
|
100
|
|
Christina M. Hoffman
|
40
|
50
|
60
|
70
|
80
|
90
|
100
|
|
V. Anthony Viozzi
|
40
|
50
|
60
|
70
|
80
|
90
|
100
|
|
Discretionary Pool
|
40
|
50
|
60
|
70
|
80
|
90
|
100
|
Note: David W. Sponic and Regional Senior Officers are not included as participants in this Plan due to their participation in individual incentive plans that are tailored to performance objectives within their
specific areas of responsibility.
4
Performance measures, performance objectives and weighting percentages for 2026 are as follows:
|
Performance
Measure
|
Performance Objectives
|
|||||||||
|
Weighting
|
|
Threshold
|
Level 1
|
Level 2
|
Target
|
Level 3
|
Level 4
|
Maximum
|
||
|
Commercial Lines Premium Growth
|
15.0%
|
2.5%
|
3.0%
|
3.5%
|
4.0%
|
4.5%
|
5.0%
|
5.5%
|
||
|
Adjusted Statutory Combined Ratio
|
70.0%
|
99.0%
|
98.0%
|
97.0%
|
96.0%
|
95.5%
|
95.0%
|
94.5%
|
||
|
Operating Return on Equity
|
15.0%
|
7.0%
|
8.0%
|
9.0%
|
10.0%
|
11.0%
|
12.0%
|
13.0%
|
||
5
EXHIBIT 10.21
DONEGAL MUTUAL INSURANCE COMPANY
DONEGAL GROUP INC.
LONG-TERM EXECUTIVE INCENTIVE PLAN
Purpose
The Long-Term Executive Incentive Plan (this “Plan”) provides for the payment of performance-based bonuses to Plan participants based upon the Donegal Insurance Group’s achievement of profitable performance over a three-year period. The key
performance measure for this Plan is the adjusted statutory combined ratio, as defined in this Plan.
The Compensation Committee of the Boards of Directors of Donegal Mutual Insurance Company and Donegal Group Inc. (the “Committee”) shall have the sole and absolute discretion to interpret and apply the terms of this Plan, including, but not
limited to, the determination of the achievement of the performance objective of Appendix 1.
Scope
The calculation of the adjusted statutory combined ratio will be based on the combined statutory financial results for the 2026, 2027 and 2028 calendar years for the Donegal Insurance Group, which includes the following legal entities for the
purposes of this Plan:
Donegal Mutual Insurance Company
Atlantic States Insurance Company
Michigan Insurance Company
Mountain States Commercial Insurance Company
Mountain States Indemnity Company
Peninsula Indemnity Company
Peninsula Insurance Company
Southern Insurance Company of Virginia
Southern Mutual Insurance Company
Performance Measures
Adjusted Statutory Combined Ratio –statutory combined ratio based on three-year financial results excluding any catastrophe adjustment(s), all executive incentive plan bonus payments and/or accruals and a stock option expense adjustment (see
definitions below).
Bonus Formula
Each participant in this Plan shall be eligible to receive a bonus by multiplying the participant’s 2028 base salary, as defined in this Plan, by the bonus percentage shown in Appendix 1 that correlates to the average statutory combined ratio
over the three-year period.
1
The calculation methodology is illustrated below:
| • |
Average Statutory Combined Ratio of 97.0% = 40% x 2028 Base Salary = Performance Bonus
|
Key Definitions
Base Salary – total wages as reported on a participant’s W-2 for 2028, excluding any taxable fringe benefits, short or long-term disability pay, gains from exercise of stock options, equity incentive compensation and prior-year bonus.
Statutory Combined Ratio – sum of the net loss and loss expense ratio (net losses and loss expenses incurred divided by net premiums earned), the expense ratio (underwriting expenses less installment fee income divided by net premiums written)
and the dividend ratio (policyholder dividends incurred divided by net premiums earned).
Catastrophe Adjustment – an adjustment will be provided to the statutory combined ratio for the purpose of this Plan to limit the net effect of the single largest catastrophe event per year to $15 million. For purposes of this provision, a
catastrophe event is defined as an event to which the Property Claims Services unit of Verisk Analytics, Inc. assigns a catastrophe number and for which the net effect to the Donegal Insurance Group exceeds $15 million when aggregating losses
incurred, LAE incurred and reinstatement premiums payable to reinsurers.
Equity Incentive Compensation Expense Adjustment – an adjustment will be provided to statutory combined ratio for the purpose of this Plan to remove the effect of equity incentive compensation expense included in the statutory financial
statements.
Additional Provisions
| 1. |
Participants must be employed by Donegal Mutual Insurance Company on or before January 1, 2026 to be eligible to participate in this Plan. Participants must be employed by the Donegal Mutual Insurance Company on December 31, 2028 in
order to receive a bonus payment under this Plan.
|
| 2. |
A 25% reduction in the bonus payable under this Plan will occur if the employees and managers of Donegal Mutual Insurance Company fail to qualify for bonuses under their respective annual incentive plans in any calendar year included in
the three-year period covered by this Plan.
|
| 3. |
Any bonuses earned under this Plan shall be paid prior to March 15, 2029.
|
| 4. |
Approved participants in this Plan are listed in Appendix 1. Any changes to the participants in this Plan must be approved by the Committee.
|
| 5. |
This plan expires on December 31, 2028. The incentive payment will be a one-time payment based on the three-year average statutory combined ratio. Upon the expiration of this Plan, the Committee will be responsible for determining
whether to implement a new long-term executive incentive plan.
|
| 6. |
Payment of bonuses under this Plan may be capped by the Committee in their sole discretion.
|
2
Appendix 1
LONG-TERM EXECUTIVE INCENTIVE PLAN
Calendar Years 2026, 2027 and 2028
|
ADJUSTED COMBINED RATIO
|
INCENTIVE
|
|
|
Over 100%
|
None
|
|
|
99.0 – 99.99%
|
15%
|
|
|
98.0 – 98.99%
|
25%
|
|
|
97.0 – 97.99%
|
40%
|
|
|
96.0 – 96.99%
|
50%
|
|
|
95.0 – 95.99%
|
60%
|
|
|
94.0 – 94.99%
|
70%
|
|
|
UNDER 94.0%
|
85%
|
The participants eligible for the 2026-2028 Long-Term Executive Incentive Plan are as follows:
| ➢ |
Kevin G. Burke
|
| ➢ |
W. Daniel DeLamater
|
| ➢ |
Jeffery T. Hay
|
| ➢ |
Jeffrey D. Miller
|
| ➢ |
Sanjay Pandey
|
| ➢ |
Kristi S. Altshuler
|
| ➢ |
David B. Bawel
|
| ➢ |
Noland R. Deas, Jr.
|
| ➢ |
William A. Folmar
|
| ➢ |
Rick J. Hecker
|
| ➢ |
Christina M. Hoffman
|
| ➢ |
David W. Sponic
|
| ➢ |
V. Anthony Viozzi
|
3
EXHIBIT 19
DONEGAL GROUP INC.
DONEGAL MUTUAL INSURANCE COMPANY
Insider Trading Policy
| I. |
GENERAL RULE
|
No Director (as defined in paragraph A of Section II), Officer (as defined in paragraph B of Section II) or employee of Donegal Group Inc. (“DGI”) or Donegal Mutual Insurance Company (“Donegal Mutual”) shall engage in
transactions in securities issued by DGI while in possession of material, non-public information concerning DGI or if the Director or Officer has not complied to the extent applicable with Rule 144 of the Securities and Exchange Commission (the
“SEC”). See paragraphs D, F and G of Section II of this Insider Trading Policy (this “Policy”) for definitions of “related interests,” “material information” and “non-public information.” This restriction also applies to the Related Interests (as
defined in paragraph D of Section II) of a Director or Officer.
Similarly, a Director or Officer shall not trade in the securities of another corporation if the Director or Officer is aware of material non-public information about that other corporation or that would be
expected to have an impact on that corporation whether or not the Director or Officer obtained possession of the material non-public information relating to or impacting that other corporation as part of the Director or Officer’s employment or
service with DGI or Donegal Mutual. Examples of this type of information could relate to customers or suppliers of DGI or Donegal Mutual or those with whom DGI or Donegal Mutual may be negotiating a transaction, or competitors of such companies,
DGI or Donegal Mutual.
A Director or Officer’s possession of material non-public information concerning a corporation in connection with transactions by that person in the securities of that corporation or the communication by that person of
that information to others who then engage in transaction in securities issued by that corporation violates the federal securities laws. Such a communication constitutes “tipping” and is one form of illegal insider trading. This Policy expressly
prohibits both trading while in the possession of inside information and tipping.
Insider trading violations of the federal securities laws often result in harsh consequences for the person who engaged in insider trading, including:
| • |
exposure to investigations by the SEC;
|
| • |
criminal and civil prosecution;
|
| • |
disgorgement of any profits realized or losses avoided through use of the information;
|
| • |
monetary fines up to three times the gain obtained or loss avoided or imprisonment; and
|
| • |
termination of employment.
|
1
Insider trading by a Director or Officer can also expose DGI and Donegal Mutual to civil liabilities and penalties. DGI and Donegal Mutual have adopted this Policy to ensure that Directors or Officers who possess
material non-public information concerning DGI or another corporation do not engage in securities transactions involving securities issued by DGI or that other corporation.
This Policy establishes pre-clearance procedures before a Director or Executive Officer (as defined in paragraph C of Section II) may engage in a transaction in securities issued by DGI which are addressed in Section
IV of this Policy. This Policy also describes limitations on the ability of a Director or Executive Officer to sell securities issued by DGI even if the Director or Executive Officer does not possess any material non-public information concerning
DGI. These limitations arise under SEC Rule 144.
Section VI of this Policy addresses SEC Rule 144.
This Policy also addresses certain other provisions of the federal securities laws that apply to Directors and Executive Officers of DGI, such as short sales or the penalties associated with buying or selling or
selling and buying Class A or Class B common stock of DGI within a six-month period. See Section III of this Policy for more information.
All Directors, Officers and employees of DGI and Donegal Mutual and their respective subsidiaries and affiliates are always subject to this Policy, the Code of Business Conduct and Ethics of DGI and the federal
securities laws, all of which prohibit transactions by a person in securities issued by DGI while that person is in the possession of material non-public information regarding DGI.
This Policy continues to apply even after termination of service to DGI and Donegal Mutual. If an individual is in possession of material non-public information when his or her service to DGI or Donegal Mutual
terminates, the individual may not engage in transactions in securities issued by DGI until that information has become public or is no longer material.
If you have any questions regarding this Policy or the pre-clearance requirements this Policy mandates or want to request any of the forms DGI has prepared to use in connection with the pre-clearance requirements,
please call our Chief Financial Officer at 717-426-1931, ext. 7357.
| II. |
DEFINITIONS
|
A. Director. Any member of the board of directors of DGI, Donegal Mutual or their respective subsidiaries or affiliates.
B. Officer. Any person who holds a position as an officer of DGI, Donegal Mutual or their respective subsidiaries and affiliates that is subject to annual appointment by their respective boards of
directors.
C. Executive Officer. Any Officer of DGI who the DGI board of directors designates annually as an “executive officer” as the SEC defines that term in Rule 3b-7 of the Securities Exchange Act of
1934, as amended (the “1934 Act”).
2
D. Related Interests. A person is considered the beneficial owner of all equity securities in which the person has a direct or indirect beneficial interest. This interest means the opportunity to
profit from or share in any profit derived from a securities transaction. The federal securities laws presume that a person has a beneficial interest in securities held by members of that person’s immediate family who share the same residence.
The definition of immediate family is broad, and includes children (natural, step or adoptive), parents, grandparents, siblings, spouses and in-laws. The concept of beneficial ownership also includes securities issued by DGI held by other
corporations, partnerships and trusts, including estate planning inter vivos trusts controlled by a Director or Officer or Related Interests of that Director or Officer. Collectively, all of these affiliated individuals and entities constitute
Related Interests.
E. Trading. Any purchase or sale, donation or gift including charitable donations and gifts, pledge of stock for a loan or the exercise of a stock option or warrant on a cashless or net basis
exercise in which securities issued by DGI are purchased or sold in a public marketplace. This definition also includes transactions by an IRA, 401(k) or trust account of a Director, Officer or Related Interest.
F. Material Information. Information relating to DGI or any other corporation with publicly-traded securities, its business operations or securities that an independent investor would likely consider
important in determining whether to buy or sell securities of DGI if the information were publicly available. Some types of information often found to be “material” are:
| • |
earnings estimates;
|
| • |
dividend increases or decreases;
|
| • |
acquisitions;
|
| • |
sales of substantial assets;
|
| • |
change in debt ratings;
|
| • |
significant write-downs of assets or additions to loss reserves or contingent liabilities;
|
| • |
liquidity problems;
|
| • |
extraordinary management developments;
|
| • |
public offerings;
|
| • |
major price or market changes;
|
| • |
significant litigation; or
|
| • |
investigations, enforcement actions or other material regulatory actions by governmental bodies.
|
3
G. Non-Public Information. A Director or Officer should consider information about DGI as “non-public” unless the Director or Officer knows the non- public information has been widely disseminated to
the general public. A Director or Officer should not consider material non-public information to be publicly available until it is generally considered widely disseminated by the press and electronic media. DGI considers information “publicly
available” on the third business day after the information has been disclosed by DGI by one of the following methods:
| • |
DGI’s website;
|
| • |
an earnings conference call;
|
| • |
the Dow Jones broad tape;
|
| • |
news wire services such as Associated Press or Reuters;
|
| • |
publication by newspapers or magazines with national circulation such as The Wall Street Journal or The New York Times; and
|
| • |
public documents filed with the SEC, such as periodic reports on Forms 8-K, 10-Q and 10-K, prospectuses or proxy statements.
|
| III. |
OTHER TRADING RESTRICTIONS ON DIRECTORS AND EXECUTIVE OFFICERS
|
A. A Director or Executive Officer may only undertake trading of securities issued by DGI during a Window Period (as hereafter defined) or an Other Period (as hereafter defined).
B. Section IV of this Policy sets forth DGI’s requirements and procedures for the pre-clearance of transactions in securities issued by DGI by a Director or Executive Officer before the execution of the
transaction.
C. Section VI of this Policy sets forth DGI’s requirements and procedures for filing SEC Forms 3, 4 and 5 with the SEC with respect to reporting changes in the beneficial ownership of securities issued by
DGI by a Director or Executive Officer of DGI. These reports are required pursuant to Section 16(a) of the 1934 Act.
D. Section 16(b) of the 1934 Act provides that a Director or Executive Officer of DGI must pay to DGI any profit realized by that Director or Executive Officer from the purchase and sale or sale and purchase
of any securities issued by DGI within a period of six months.
E. Section 16(c) of the 1934 Act prohibits a Director or Executive Officer of DGI from engaging in a short sale of securities issued by DGI.
F. The trading restrictions set forth in this Policy do not apply to an election by an Executive Officer to have DGI or Donegal Mutual withhold shares of securities issued by DGI to satisfy tax withholding
obligations due upon vesting of restricted stock units. This Policy does, however, apply to sales of shares of securities issued by DGI that are received by an Executive Officer upon vesting of restricted stock units or any other sale of securities
issued by DGI for the purpose of generating the cash needed to pay tax withholding obligations due upon vesting of restricted stock units.
4
| IV. |
REQUIREMENT FOR PRE-CLEARANCE OF TRANSACTIONS BY DIRECTORS AND EXECUTIVE OFFICERS
|
A. Pre-Clearance Required. During a Window Period or an Other Period, no Director or Executive Officer may undertake trading of any kind in any securities issued by DGI unless such Director or
Executive Officer has first satisfied the following conditions:
| • |
The Director or Executive Officer obtains a written pre-clearance letter from DGI’s President and Chief Executive Officer or Chief Financial Officer pre-clearing the proposed transaction before commencing
the proposed transaction. In requesting a pre- clearance letter, the Director or Executive Officer must provide the President and Chief Executive Officer or Chief Financial Officer of DGI a request letter in the form provided by DGI that
shall include:
|
| • |
a specific written description of all of the material details (e.g., dollar amounts and number of shares involved, type of transaction and whether pursuant to a plan) about the proposed transaction; and
|
| • |
a written representation signed by the Director or Executive Officer that affirms that the Director or Executive Officer is not aware of, and does not have possession of, any material non-public information regarding DGI. This
representation may be made by means of a conformed signature in an e- mail.
|
| • |
For stock option exercises, Computershare shall be responsible for the timely filing of any Form 144 notices required because the proposed transaction involves the sale by the Director or Executive Officer of more than 5,000 shares of
Class A or Class B common stock of DGI or aggregate proceeds of more than $50,000 in any period of three consecutive months. For all other transactions, the Chief Financial Officer of DGI shall be responsible for any such Form 144 notices
required.
|
| • |
The Director or Executive Officer shall notify the Chief Financial Officer of DGI of the execution of any transactions pursuant to a pre-clearance letter on the date of the execution of the transactions. The Chief Financial Officer of
DGI or his designee shall file on behalf of such Director or Executive Officer the SEC Forms 3, 4 or 5s required to disclose such transaction.
|
5
B. Trading Periods. To facilitate the administration of this Policy, transactions by Directors and Officers in securities issued by DGI shall be restricted as follows:
| • |
Window Periods. A Director or Officer may effect transactions in securities issued by DGI only during a Window Period or an Other Period, subject to the condition that any
Director or Executive Officer complies with the pre-clearance procedures set forth in Section IV(A). Window Periods begin on the third business day following the date of DGI’s publication of its results of operations for a calendar
quarter and expire on the earlier of the 21st calendar day following such date of publication or the close of business on the day immediately preceding the next meeting of DGI’s Board of Directors. In the event that DGI’s
President and Chief Executive Officer or Chief Financial Officer determines that a Window Period must be terminated and a Blackout Period imposed, DGI will so notify each Director and Officer.
|
| • |
Blackout Periods. Directors or Officers may not engage in transactions involving securities issued by DGI during a Blackout Period, subject to the limited exception set
forth below. Blackout Periods begin on the 15th day of the last month of each calendar quarter and continue until the commencement of the next Window Period. In the event a Director or Officer has an unanticipated personal
hardship, DGI may permit a transaction involving securities issued by DGI during a Blackout Period provided the proposed transaction receives the prior approval of three members of DGI’s Board of Directors, the Director or Officer does
not then possess material non-public information regarding DGI and the Director or Officer complies with the pre-clearance procedures as provided in Section IV(A) of this Policy.
|
| • |
Other Periods: Other Periods begin on the first calendar day following the expiration of a Window Period and continue until the first day of the next succeeding Blackout
Period. All proposed transactions by a Director or Officer in securities issued by DGI during an Other Period shall only be effected in compliance with the pre-clearance procedures as provided in Section IV(A) of this Policy. In addition
to that compliance, the issuance of a pre- clearance letter in compliance with Section IV(A)(2) shall require the written determination of the President and Chief Executive Officer of DGI or Chief Financial Officer of DGI that the
proposed transaction is appropriate in light of facts and circumstances then prevailing.
|
| V. |
TRADING PLANS
|
A Director or Officer must apply for approval to adopt an SEC Rule 10b5-1 trading plan by written request to DGI’s President and Chief Executive Officer or DGI’s Chief Financial Officer. To request approval of an SEC
Rule 10b5-1 trading plan, the Director or Officer must comply with the procedures set forth in Sections III (B) and (C) of this Policy. Approval of the adoption of SEC Rule 10b5-1 trading plans by DGI’s President and Chief Executive Officer or
Chief Financial Officer is discretionary. The request for approval by the Director or Officer shall also acknowledge that:
| • |
The Director or Officer is entering into the plan in good faith and not as a scheme to evade SEC Rule 10b5-1; and
|
6
| • |
Upon adoption of an SEC Rule 10b5-1 trading plan, the Director or Officer shall comply with this Policy, the Code of Business Conduct and Ethics of DGI and applicable provisions of the federal securities laws.
|
As part of the establishment of an SEC Rule 10b5-1 trading plan, a Director or Officer shall enter into a binding contract, instruction or written plan for the routine periodic purchase or sale of securities issued by
DGI under specified terms and conditions at a time when the Director or Officer does not possess material non-public information regarding DGI.
A. The binding contract, instruction or written plan must:
| • |
expressly specify the securities the Director or Officer proposes to purchase or sell, the prices at which and the dates on which the Director or Officer proposes to purchase or sell securities issued by DGI;
|
| • |
include a written formula or algorithm, or computer program, for determining amounts, prices and dates; or
|
| • |
not permit the Director or Officer to exercise any subsequent influence over how, when or whether to effect purchases or sales, provided, in addition, that any other person who does exercise such influence pursuant to the binding
contract, instruction or written plan, such as a broker, is not aware of any material non-public information relating to DGI when doing so.
|
B. Upon the President and Chief Executive Officer’s or Chief Financial Officer’s approval of a Rule 10b5-1 trading plan, further transactions by that Director or Officer in securities issued by DGI pursuant
to that plan do not require further action by DGI under this Policy. However, a purchase or sale under Rule 10b5-1 is not protected from liability if the Director or Officer alters or deviates from the binding contract, instruction or written plan,
whether by changing the amount, price or timing of the purchase or sale or enters into or alters a corresponding or hedging transaction or position with respect to those securities.
C. A binding contract, instruction or written plan pursuant to Rule 10b5-1 shall also comply with all other applicable disclosure, reporting and other requirements under federal and state securities laws. In
addition, DGI may require that all approved binding contracts, instructions or plans include additional safeguards for the benefit of DGI, such as compliance with customary lockup commitments associated with underwritings of securities offered by
DGI. Further, a Director or Officer shall advise the President and Chief Executive Officer or the Chief Financial Officer in writing in advance of any proposed modification to, or termination of such a binding contract, instruction or written plan
concerning trades to be conducted pursuant to Rule 10b5-1 and such modifications shall not become effective until the President and Chief Executive Officer or the Chief Financial Officer has approved the modification.
7
|
VI.
|
SEC REPORTING REQUIREMENTS
|
These reporting requirements apply only to Directors and Executive Officers of DGI.
A. Form 4: Two-Day Filing Requirement
| • |
The Form 4 two-day period begins to run on the date of execution of the transaction, e.g., a purchase or sale of a security issued by DGI on a Monday must be reported to the SEC before 10:00 p.m. eastern time on the ensuing Wednesday.
|
| • |
Securities transactions subject to Section 16 of the 1934 Act include any transactions in which a Director or Executive Officer has a beneficial interest, including transactions by a Director or Executive Officer’s Related Interests.
|
| • |
The following Director or Executive Officer transactions involving securities issued by DGI are subject to the two-day Form 4 filing requirements:
|
| • |
purchases or sales of securities issued by DGI in either brokered transactions or private transactions;
|
| • |
stock option grants;
|
| • |
restricted stock grants;
|
| • |
stock option exercises, including cashless exercises;
|
| • |
purchases or sales of securities issued by DGI on behalf of a trust for which the Director or Executive Officer serves as trustee or is a beneficiary; and
|
| • |
bonuses or other awards in the form of DGI stock.
|
B. Form 4: Five-Day Filing Requirement
| • |
The Form 4 filing requirement provides for an extension of the Form 4 filing deadline where the Director or Executive Officer may not control the exact date on which the transaction occurs. The five-day filing requirement applies to
voluntary stock purchases under DGI’s Dividend Reinvestment and Stock Purchase Plan (the “Reinvestment Plan”).
|
| • |
Transactions involving DGI stock in those plans require Form 4 filings on the earlier of: (i) two days after the date the Director or Executive Officer is notified of the completion of the trade or (ii)
the fifth business day following the transaction. Because of the fifth day following the transaction may occur before the Director or Executive Officer receives notice, DGI has implemented procedures to track Director or Executive
Officer transactions in the affected plans to ensure that timely SEC filings occur with respect to all reportable transactions.
|
8
C. Transactions Exempt From SEC Reporting
| • |
The following transactions by Directors and Executive Officers of DGI remain exempt from SEC Section 16, and do not require any filing with the SEC:
|
| • |
acquisitions of DGI Class A common stock through normal payroll contributions to DGI’s 401(k) Plan, including matching contributions made by DGI;
|
| • |
acquisitions of DGI Class A or Class B common stock through stock splits or stock dividends;
|
| • |
reinvestment of dividends to purchase DGI Class A common stock, but not voluntary purchases, under the Reinvestment Plan; and
|
| • |
purchases of DGI Class A common stock under DGI’s employee stock purchase plan and agents stock purchase plan.
|
| • |
Gifts of shares of common stock of DGI by Directors and Executive Officers must be reported annually on Form 5, unless the Director or Executive Officer has previously filed a Form 4 on a voluntary basis to report the gift.
|
D. Compliance Procedures
| • |
Electronic Filing/Powers of Attorney: All Directors or Executive Officers shall, with the assistance of the Chief Financial Officer of DGI, obtain a code identification from
the SEC, which code will permit the Chief Financial Officer of DGI or his designee to file electronically all Forms 3, 4 or 5 and Forms 144 on behalf of such Director or Executive Officer.
|
| • |
Broker Requirements: All Directors or Executive Officers are urged to register their shares with Computershare and not hold them in broker street name. If such Director’s or
Executive Officer’s shares are held in broker street name, then the Director or Executive Officer and any Related Interests are required to execute a Broker Instruction Form with their broker. This Form imposes the following two
restrictions on brokers who propose to execute purchases and sales of stock of DGI on behalf of such Director or Executive Officer:
|
| • |
not to enter any order without confirming with the Chief Financial Officer of DGI that the transaction has been pre- cleared and complies with the brokerage firm’s compliance procedures (e.g. Rule 144); and
|
9
| • |
to advise the Chief Financial Officer of DGI regarding the relevant details of all purchases or sales in DGI stock conducted by the broker simultaneously with the execution of the transaction.
|
| • |
Rule 144 Requirements. A Director or Executive Officer of DGI must comply with the provisions of the Securities Act of 1933, as amended (the “1933 Act”) prior to effecting
sales of DGI’s Class A or Class B common stock in a public market. In order for any such person to sell shares of DGI Class A or Class B common stock, the sale of the shares must either be registered under the 1933 Act, which is unlikely
to occur, or comply with an exemption from such registration. This requirement for registration or exemption with respect to a sale of shares of DGI’s Class A or Class B common stock applies to all shares held by a Director or Executive
Officer, including, but not limited to, shares purchased on the open market or shares purchased privately.
|
Under Rule 144, all securities issued by DGI that Directors or Executive Officers hold are treated as restricted securities even if the shares held by the Director or Executive Officer were registered when the
Director or Executive Officer acquired the shares or the Director or Executive Officer purchased the shares in a Nasdaq Global Select Market, Inc. (“NASDAQ”) transaction. A Director or Executive Officer must comply with the following requirements
of Rule 144 in connection with any sale of common stock of DGI, except as noted below:
| • |
The Director or Executive Officer must file a Form 144 with the SEC concurrently with placing the sale order with a broker or upon execution of the trade with a market maker if the contemplated sale involves more than 5,000 shares of
common stock of DGI or $50,000 in gross proceeds in any period of three consecutive months.
|
| • |
DGI must be current in its reporting requirements under the 1934 Act at the time of sale;
|
| • |
If the shares of DGI proposed to be sold were acquired in a private transaction (i.e., directly from DGI or an affiliate), the Director or Executive Officer must have held and beneficially owned the shares for a period of six months
before a sale can be made under Rule 144.
|
| • |
The amount of common stock of DGI that may be sold in any period of three consecutive months may not exceed the greater of 1% of the outstanding common stock of DGI (approximately 250,000 shares) or the average weekly trading volume on
NASDAQ during the four calendar weeks preceding the sale; and
|
10
| • |
The common stock of DGI must be sold in unsolicited “brokers’ transactions” or directly to “market makers” or in “riskless principal transactions” as those terms are defined in Rule 144.
|
| VII. |
INTERPRETATION
|
DGI shall interpret the requirements of this Policy in a manner that is consistent with the applicable requirements of the federal securities laws.
Approved by DGI and Donegal Mutual Boards of Directors on December 18, 2025
11
EXHIBIT 21
SUBSIDIARIES OF REGISTRANT
Registrant owned 100% of the outstanding stock of the following companies as of December 31, 2025, except as noted:
|
Name
|
State of Incorporation
|
|
|
Atlantic States Insurance Company
|
Pennsylvania
|
|
|
Southern Insurance Company of Virginia
|
Virginia
|
|
|
The Peninsula Insurance Company
|
Pennsylvania
|
|
|
Peninsula Indemnity Company*
|
Pennsylvania
|
|
|
Michigan Insurance Company
|
Michigan
|
____________________
* Wholly owned by The Peninsula Insurance Company.
EXHIBIT 23.1
CONSENT OF
INDEPENDENT REGISTERED PUBLIC ACCOUNTING FIRM
We consent to the incorporation by reference in the registration statements (Nos. 333-89644, 333-233167, 333-261715 and 333-278931) on Form S-8 and registration statements (Nos. 333-59828 and 333-281858) on Form S-3 of
our reports dated March 6, 2026, with respect to the consolidated financial statements and financial statement schedule III of Donegal Group Inc. and the effectiveness of internal control over financial reporting.
/s/ KPMG LLP
Philadelphia, Pennsylvania
March 6, 2026
CERTIFICATION
I, Kevin G. Burke, certify that:
1. I have reviewed this annual report on Form 10-K for the year ended December 31, 2025 of Donegal Group Inc.;
2. Based on my knowledge, this report does not contain any untrue statement of a material fact or omit to state a material fact necessary to make the statements made, in light of the circumstances under which such
statements were made, not misleading with respect to the period covered by this report;
3. Based on my knowledge, the financial statements, and other financial information included in this report, fairly present in all material respects the financial condition, results of operations and cash flows of the
registrant as of, and for, the periods presented in this report;
4. The registrant's other certifying officer and I are responsible for establishing and maintaining disclosure controls and procedures (as defined in Exchange Act Rules 13a-15(e) and 15d-15(e)) and internal control over
financial reporting (as defined in Exchange Act Rules 13a-15(f) and 15d-15(f)) for the registrant and have:
(a) Designed such disclosure controls and procedures, or caused such disclosure controls and procedures to be designed under our supervision, to ensure that material information relating to the registrant, including its
consolidated subsidiaries, is made known to us by others within those entities, particularly during the period in which this report is being prepared;
(b) Designed such internal control over financial reporting, or caused such internal control over financial reporting to be designed under our supervision, to provide reasonable assurance regarding the reliability of
financial reporting and the preparation of financial statements for external purposes in accordance with generally accepted accounting principles;
(c) Evaluated the effectiveness of the registrant's disclosure controls and procedures and presented in this report our conclusions about the effectiveness of the disclosure controls and procedures, as of the end of the
period covered by this report based on such evaluation; and
(d) Disclosed in this report any change in the registrant's internal control over financial reporting that occurred during the registrant's most recent fiscal quarter (the registrant's fourth fiscal quarter in the case of
an annual report) that has materially affected, or is reasonably likely to materially affect, the registrant's internal control over financial reporting; and
5. The registrant's other certifying officer and I have disclosed, based on our most recent evaluation of internal control over financial reporting, to the registrant's auditors and the audit committee of registrant's
board of directors (or persons performing the equivalent functions):
(a) All significant deficiencies and material weaknesses in the design or operation of internal control over financial reporting which are reasonably likely to adversely affect the registrant's ability to record, process,
summarize and report financial information; and
(b) Any fraud, whether or not material, that involves management or other employees who have a significant role in the registrant's internal control over financial reporting.
|
/s/ Kevin G. Burke
|
|
|
Kevin G. Burke, President and Chief Executive Officer
|
Date: March 6, 2026
CERTIFICATION
I, Jeffrey D. Miller, certify that:
1. I have reviewed this annual report on Form 10-K for the year ended December 31, 2025 of Donegal Group Inc.;
2. Based on my knowledge, this report does not contain any untrue statement of a material fact or omit to state a material fact necessary to make the statements made, in light of the circumstances under which such
statements were made, not misleading with respect to the period covered by this report;
3. Based on my knowledge, the financial statements, and other financial information included in this report, fairly present in all material respects the financial condition, results of operations and cash flows of the
registrant as of, and for, the periods presented in this report;
4. The registrant's other certifying officer and I are responsible for establishing and maintaining disclosure controls and procedures (as defined in Exchange Act Rules 13a-15(e) and 15d-15(e)) and internal control over
financial reporting (as defined in Exchange Act Rules 13a-15(f) and 15d-15(f)) for the registrant and have:
(a) Designed such disclosure controls and procedures, or caused such disclosure controls and procedures to be designed under our supervision, to ensure that material information relating to the registrant, including its
consolidated subsidiaries, is made known to us by others within those entities, particularly during the period in which this report is being prepared;
(b) Designed such internal control over financial reporting, or caused such internal control over financial reporting to be designed under our supervision, to provide reasonable assurance regarding the reliability of
financial reporting and the preparation of financial statements for external purposes in accordance with generally accepted accounting principles;
(c) Evaluated the effectiveness of the registrant's disclosure controls and procedures and presented in this report our conclusions about the effectiveness of the disclosure controls and procedures, as of the end of the
period covered by this report based on such evaluation; and
(d) Disclosed in this report any change in the registrant's internal control over financial reporting that occurred during the registrant's most recent fiscal quarter (the registrant's fourth fiscal quarter in the case of
an annual report) that has materially affected, or is reasonably likely to materially affect, the registrant's internal control over financial reporting; and
5. The registrant's other certifying officer and I have disclosed, based on our most recent evaluation of internal control over financial reporting, to the registrant's auditors and the audit committee of registrant's
board of directors (or persons performing the equivalent functions):
(a) All significant deficiencies and material weaknesses in the design or operation of internal control over financial reporting which are reasonably likely to adversely affect the registrant's ability to record, process,
summarize and report financial information; and
(b) Any fraud, whether or not material, that involves management or other employees who have a significant role in the registrant's internal control over financial reporting.
|
/s/ Jeffrey D. Miller
|
|
|
Jeffrey D. Miller, Executive Vice President
and Chief Financial Officer
|
Date: March 6, 2026
CERTIFICATION OF
PRESIDENT AND CHIEF EXECUTIVE OFFICER
PURSUANT TO 18 U.S.C. SECTION 1350,
AS ADOPTED PURSUANT TO
SECTION 906 OF THE SARBANES-OXLEY ACT OF 2002
In connection with the Annual Report of Donegal Group Inc. (the “Company”), on Form 10-K for the year ended December 31, 2025, as filed with the Securities and Exchange Commission (the “Report”), Kevin G. Burke, the President and Chief Executive
Officer of the Company, does hereby certify, pursuant to § 906 of the Sarbanes-Oxley Act of 2002 (18 U.S.C. § 1350), that to his knowledge:
1. The Report fully complies with the requirements of section 13(a) or 15(d) of the Securities Exchange Act of 1934; and
2. The information contained in the Report fairly presents, in all material respects, the financial condition and results of operations of the Company.
|
|
/s/ Kevin G. Burke
|
|
|
Kevin G. Burke, President and Chief Executive Officer
|
|
Date: March 6, 2026
|
CERTIFICATION OF
EXECUTIVE VICE PRESIDENT AND CHIEF FINANCIAL OFFICER
PURSUANT TO 18 U.S.C. SECTION 1350,
AS ADOPTED PURSUANT TO
SECTION 906 OF THE SARBANES-OXLEY ACT OF 2002
In connection with the Annual Report of Donegal Group Inc. (the “Company”), on Form 10-K for the year ended December 31, 2025, as filed with the Securities and Exchange Commission (the “Report”), Jeffrey D. Miller, the Executive Vice President
and Chief Financial Officer of the Company, does hereby certify, pursuant to § 906 of the Sarbanes-Oxley Act of 2002 (18 U.S.C. § 1350), that to his knowledge:
1. The Report fully complies with the requirements of section 13(a) or 15(d) of the Securities Exchange Act of 1934; and
2. The information contained in the Report fairly presents, in all material respects, the financial condition and results of operations of the Company.
|
|
/s/ Jeffrey D. Miller
|
|
|
Jeffrey D. Miller, Executive Vice President
and Chief Financial Officer
|
|
Date: March 6, 2026
|